For Monday 9-15-2025
DELL
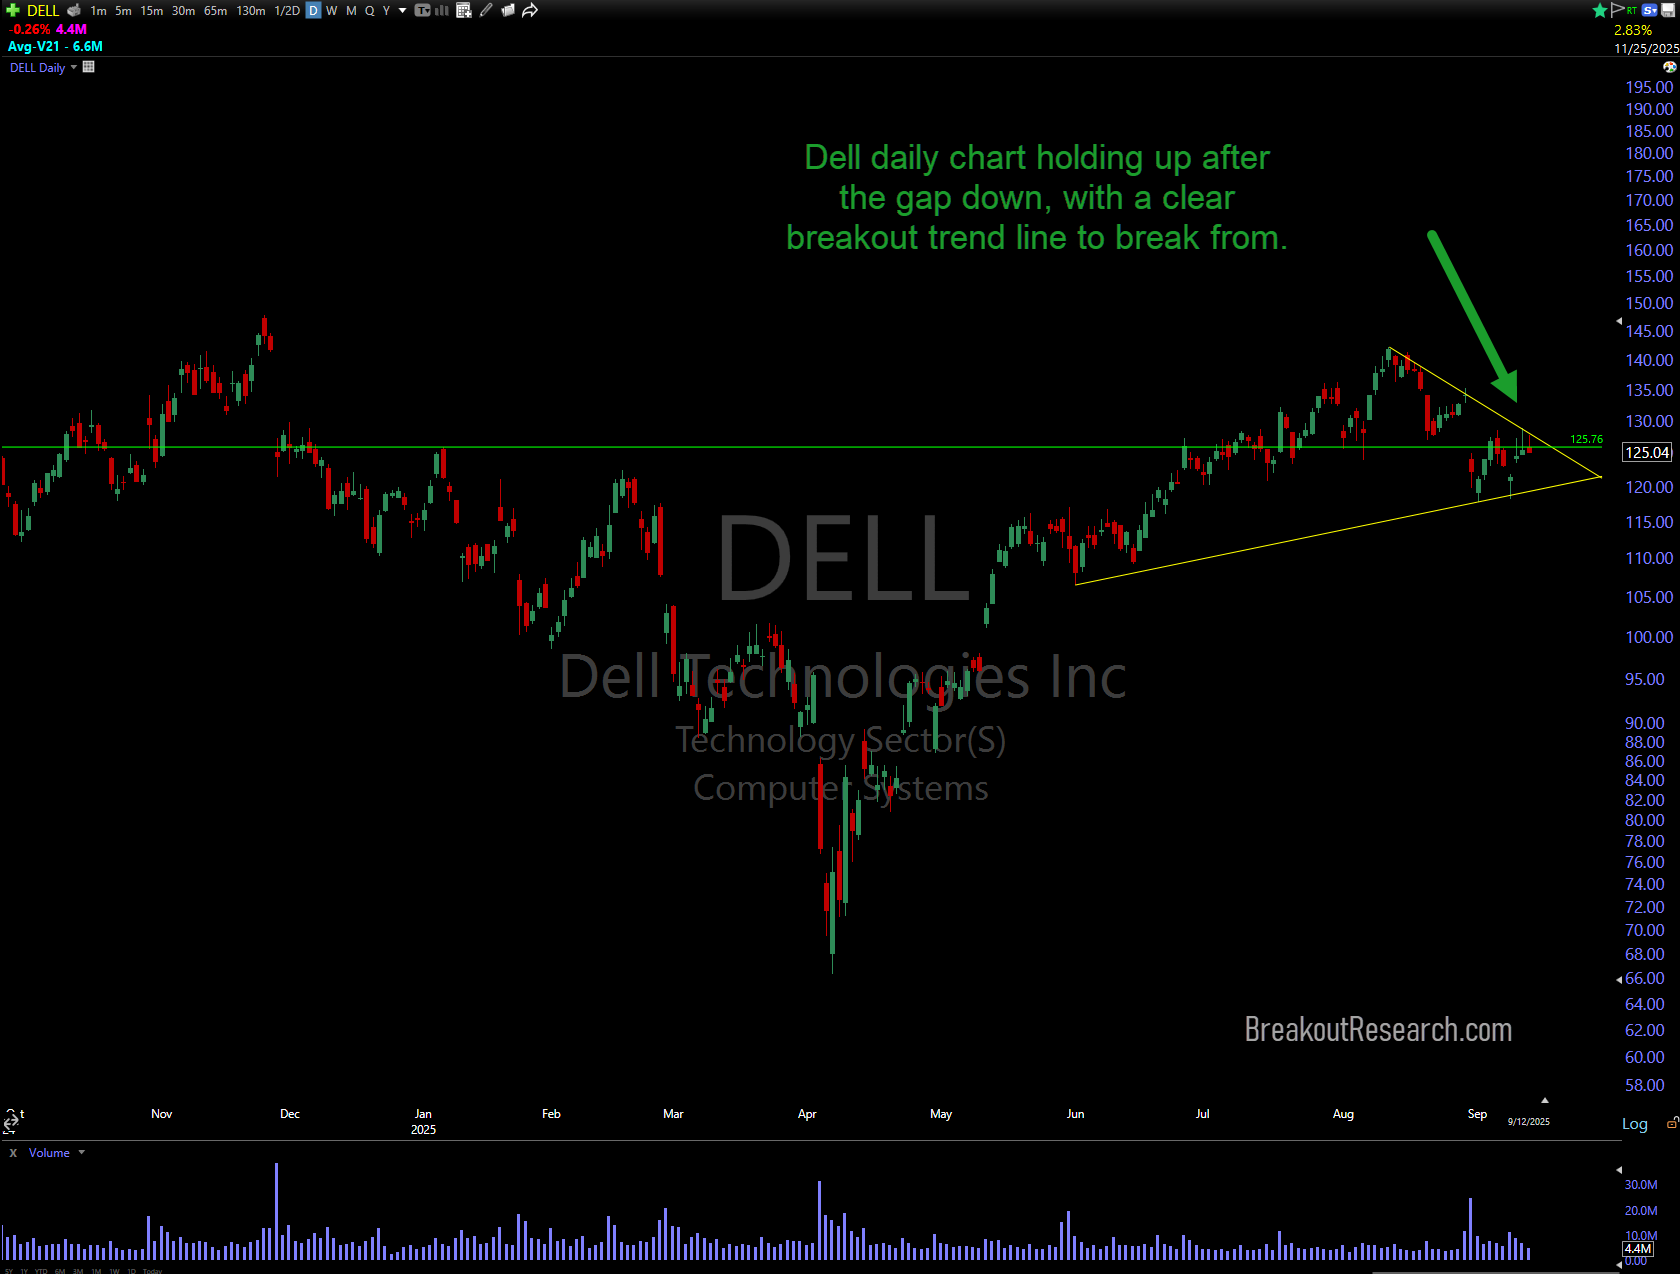
The daily chart of DELL showing a clear breakout trend line to break from.
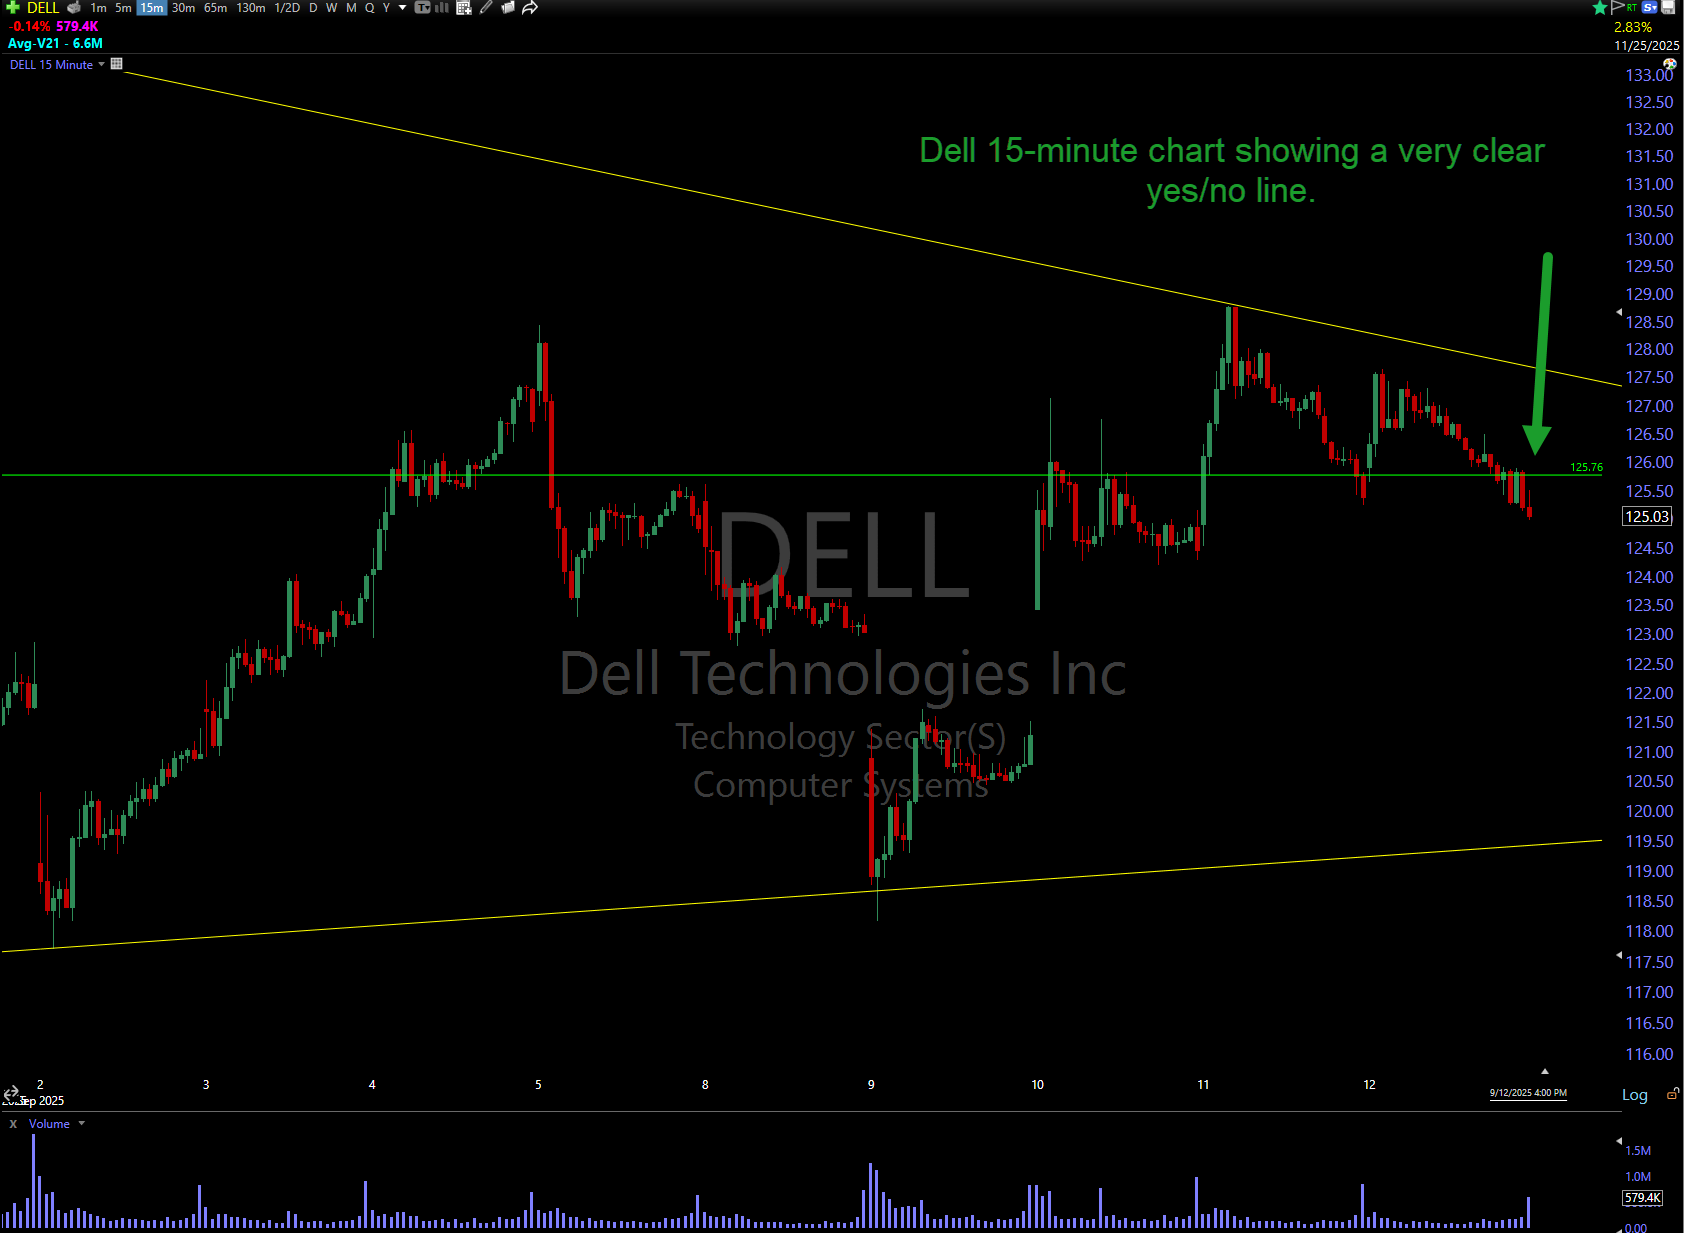
DELL 15-minute chart showing a clear yes/no line in the $126/126 area. A high volume 15min bar would get me into this trade to play for the pattern breakout on the daily chart. The yellow line above.
YEXT
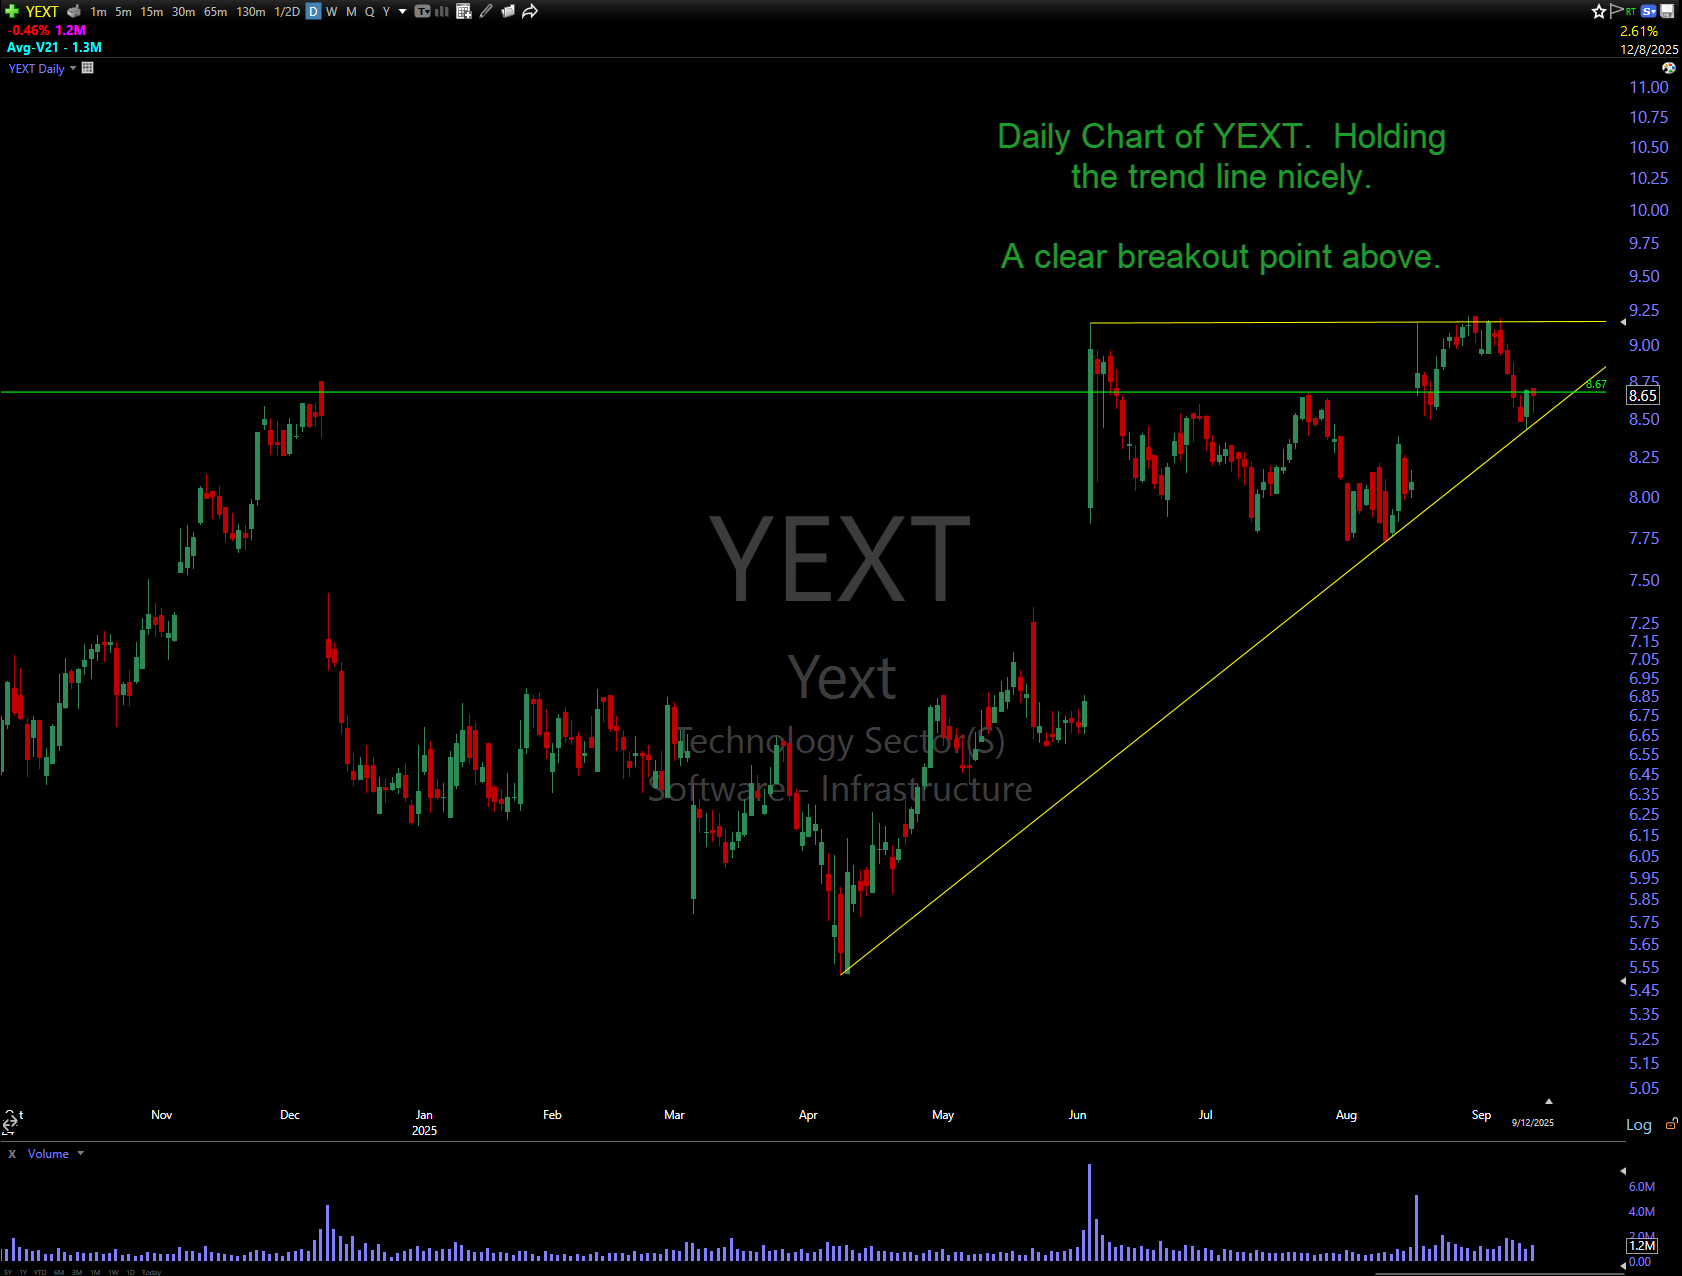
YEXT daily above showing a clear pattern.
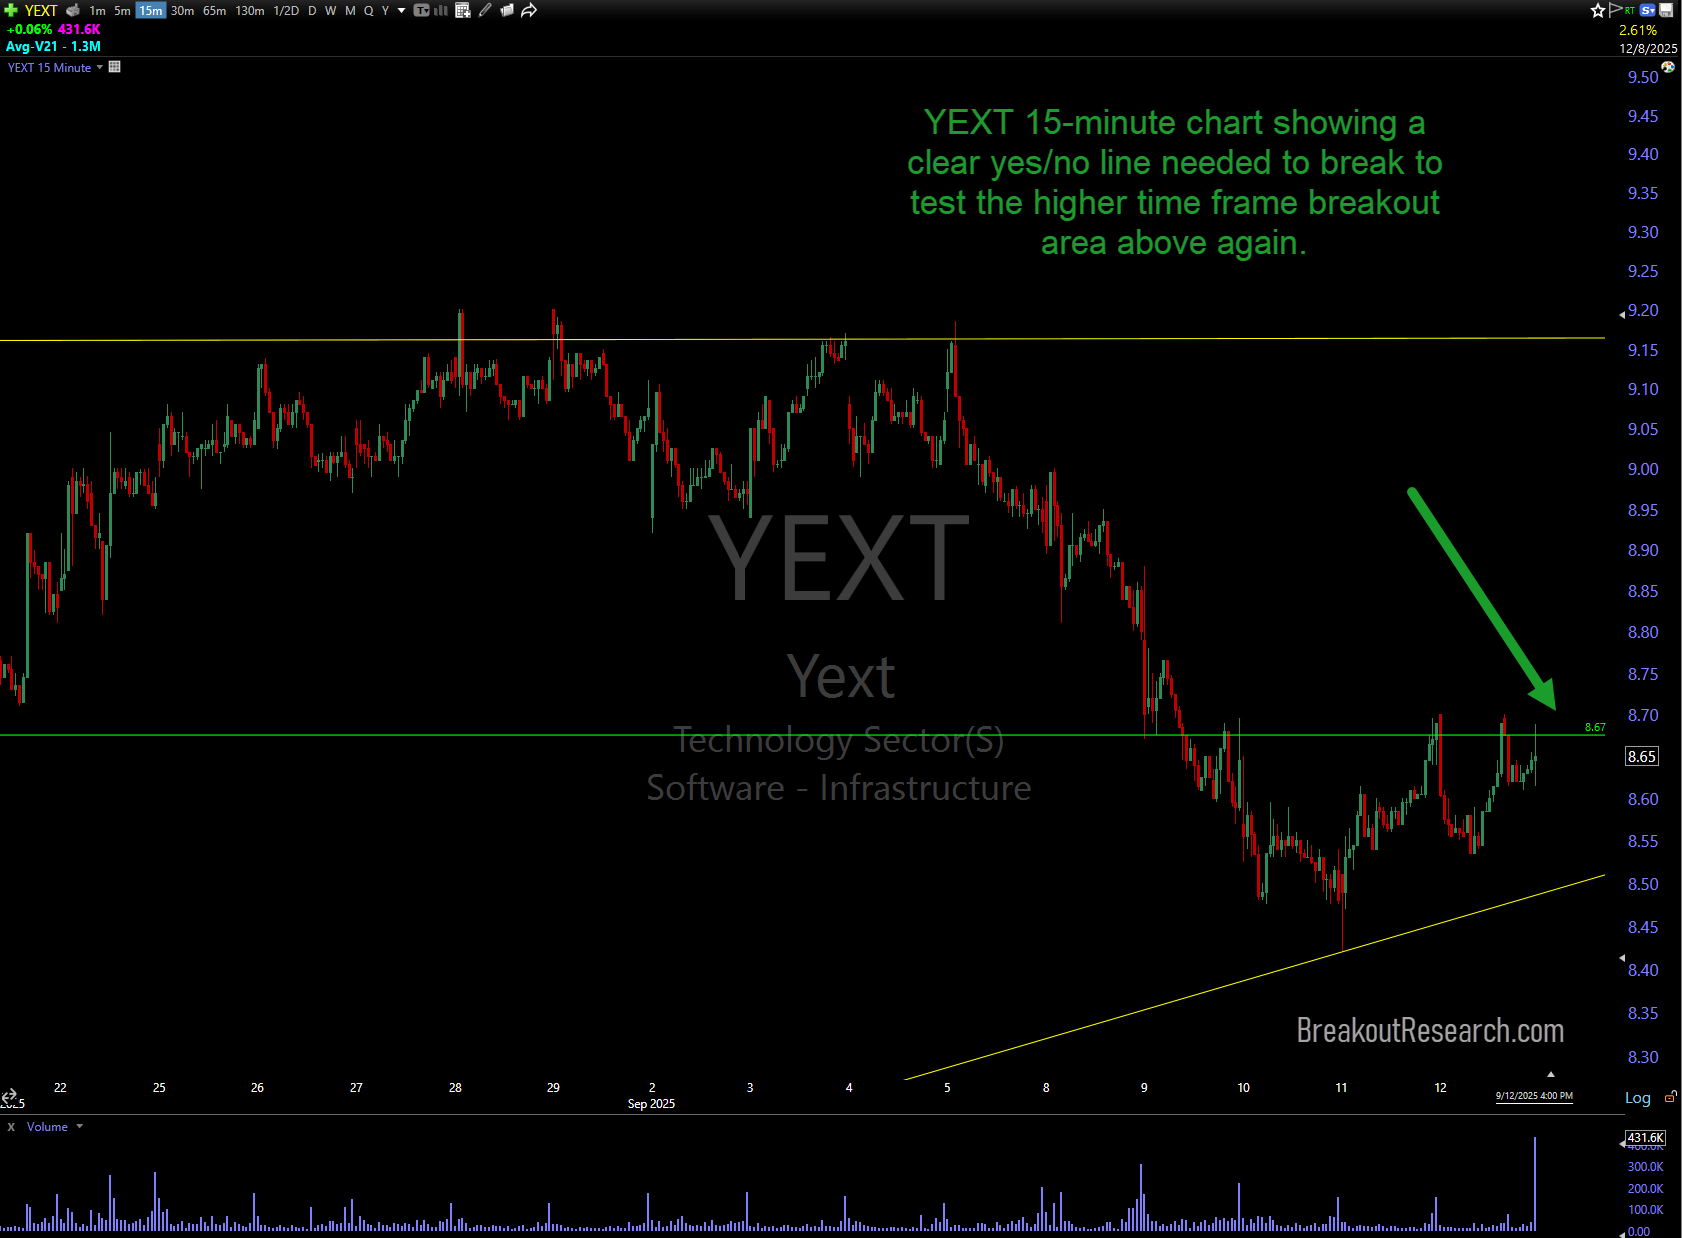
YEXT 15-minute chart above with a clear yes/no line. A high volume break above this line will get me into this trade playing for a break of the higher time frame breakout (yellow) above.
MCHP
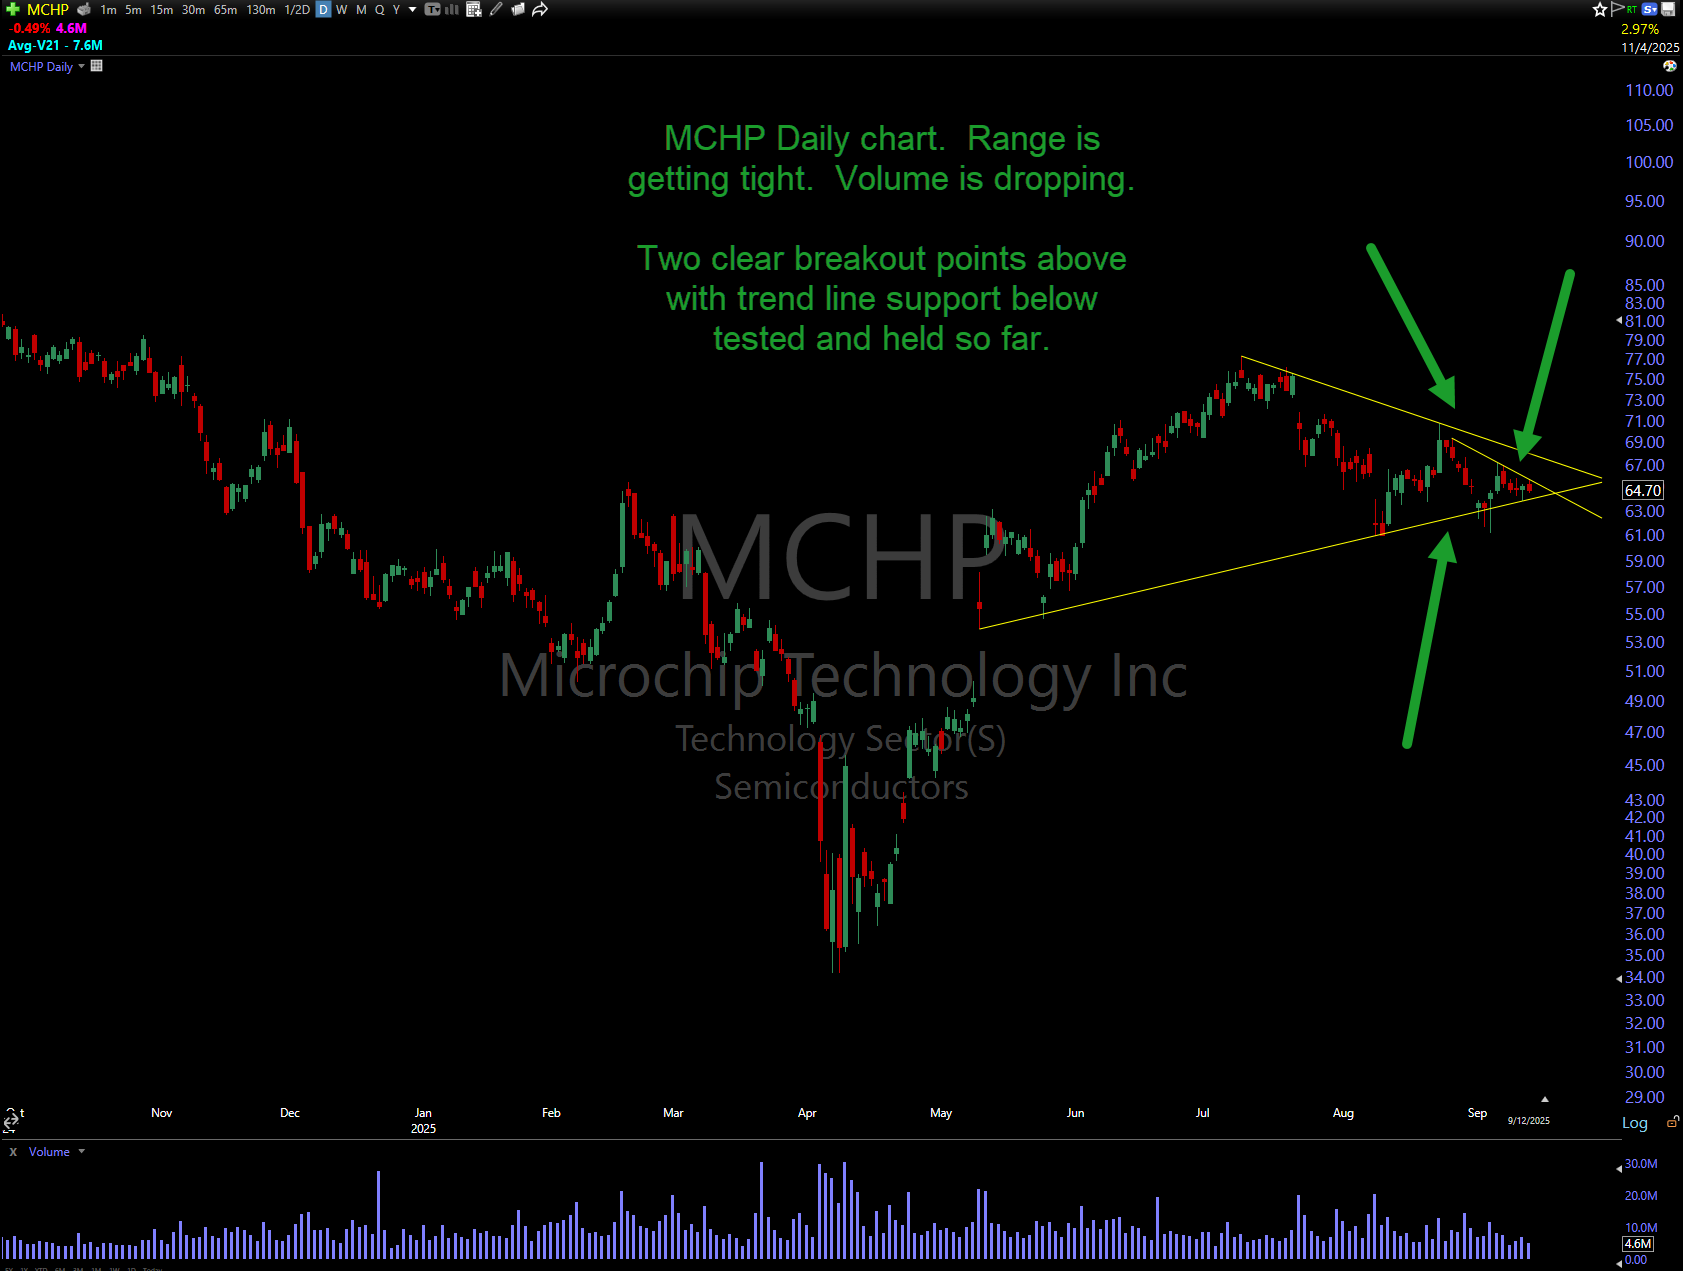
MCHP Daily chart. Showing two breakout points. One smaller then one larger.
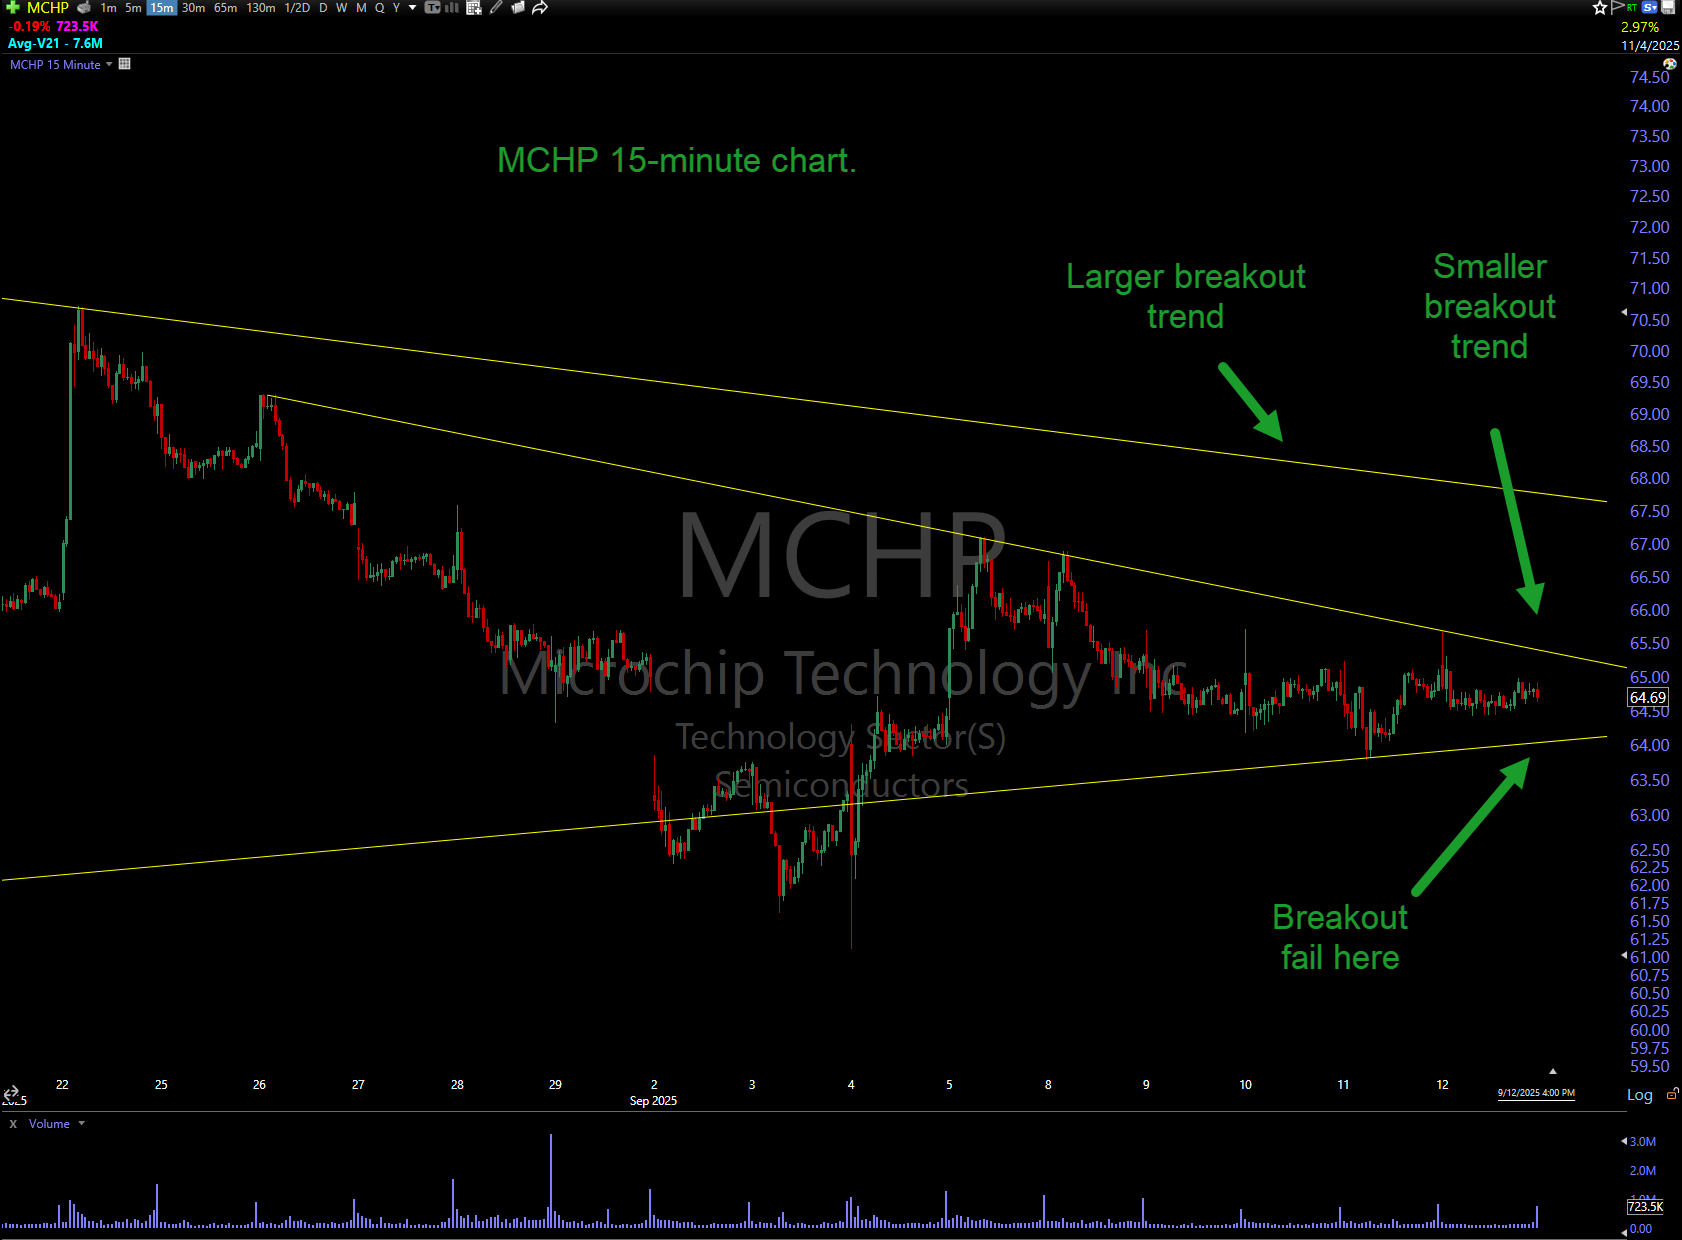
MCHP 15-minute chart. Zoomed in view of both breakout areas. I'll be looking for a high volume 15-minute bar breakout above the first yellow trend line, and will be playing for a breakout of the larger trend line above. The risk on this one is tight, as a fail below the lower trend line would invalidate the trade.
I wouldn't stop out immediately. I would stop out on sustained selling below without any attempts to reclaim. These have a tenancy to fake hard the slingshot back up.
SPOT
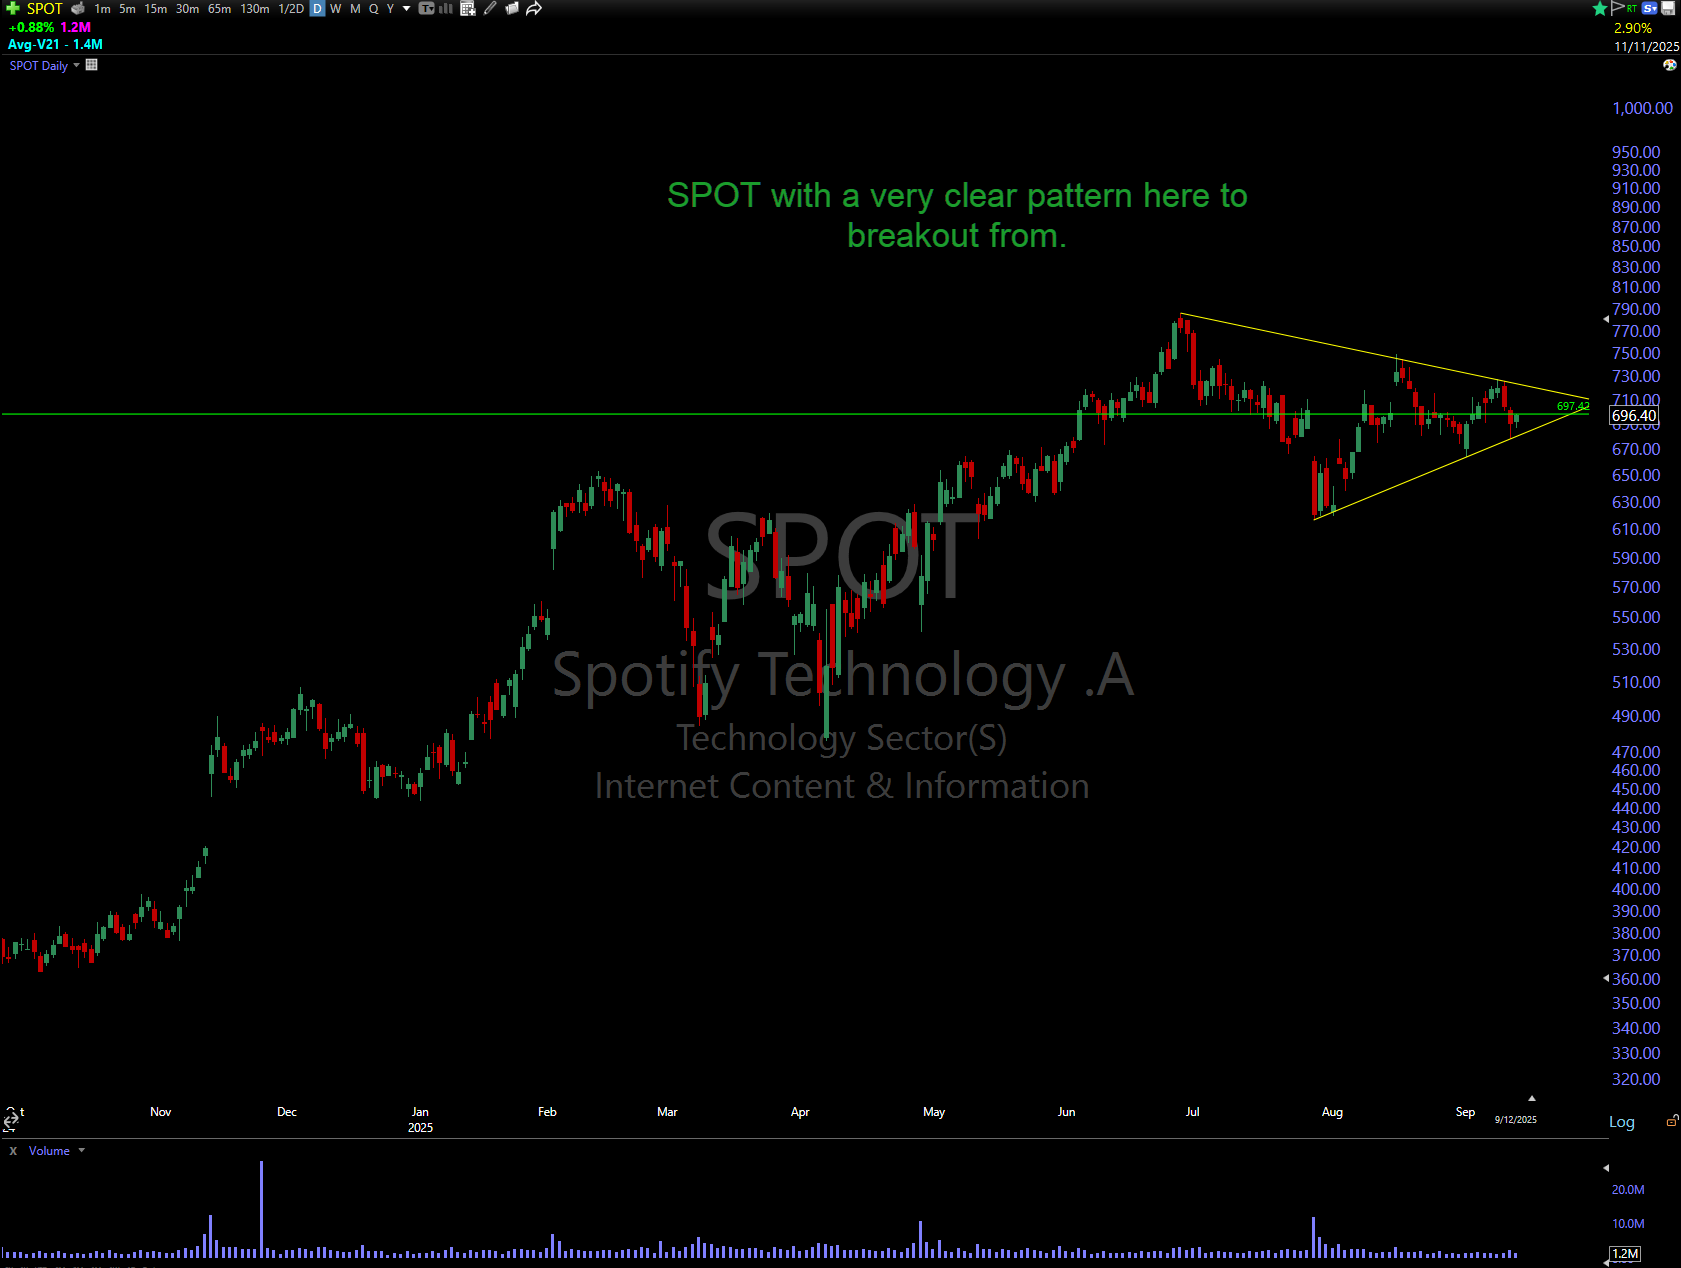
Nice chart pattern here on SPOT.
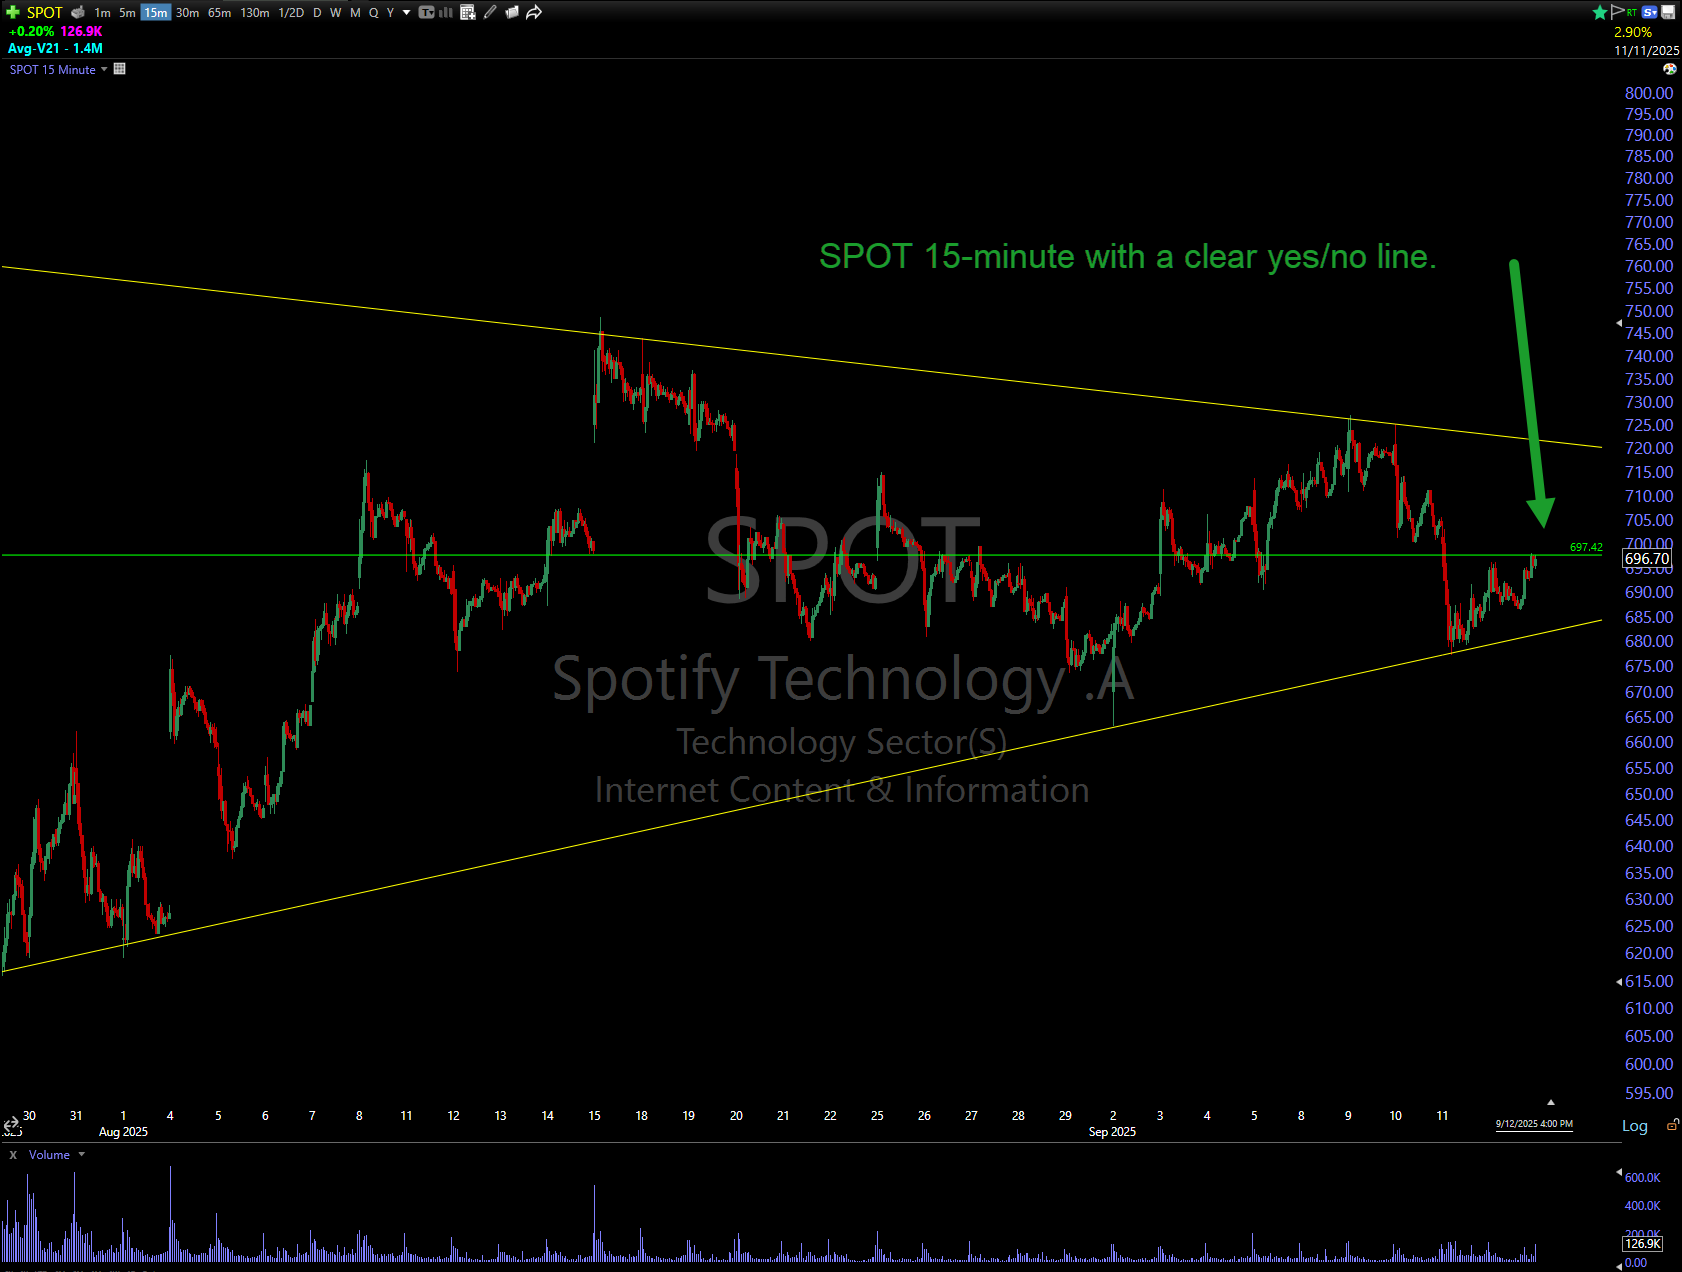
SPOT 15-minute chart above showing a clear yes/no line needed to break from. I'll be watching for a high volume bar above this area to play for the higher time frame (yellow) breakout above.
ARLO
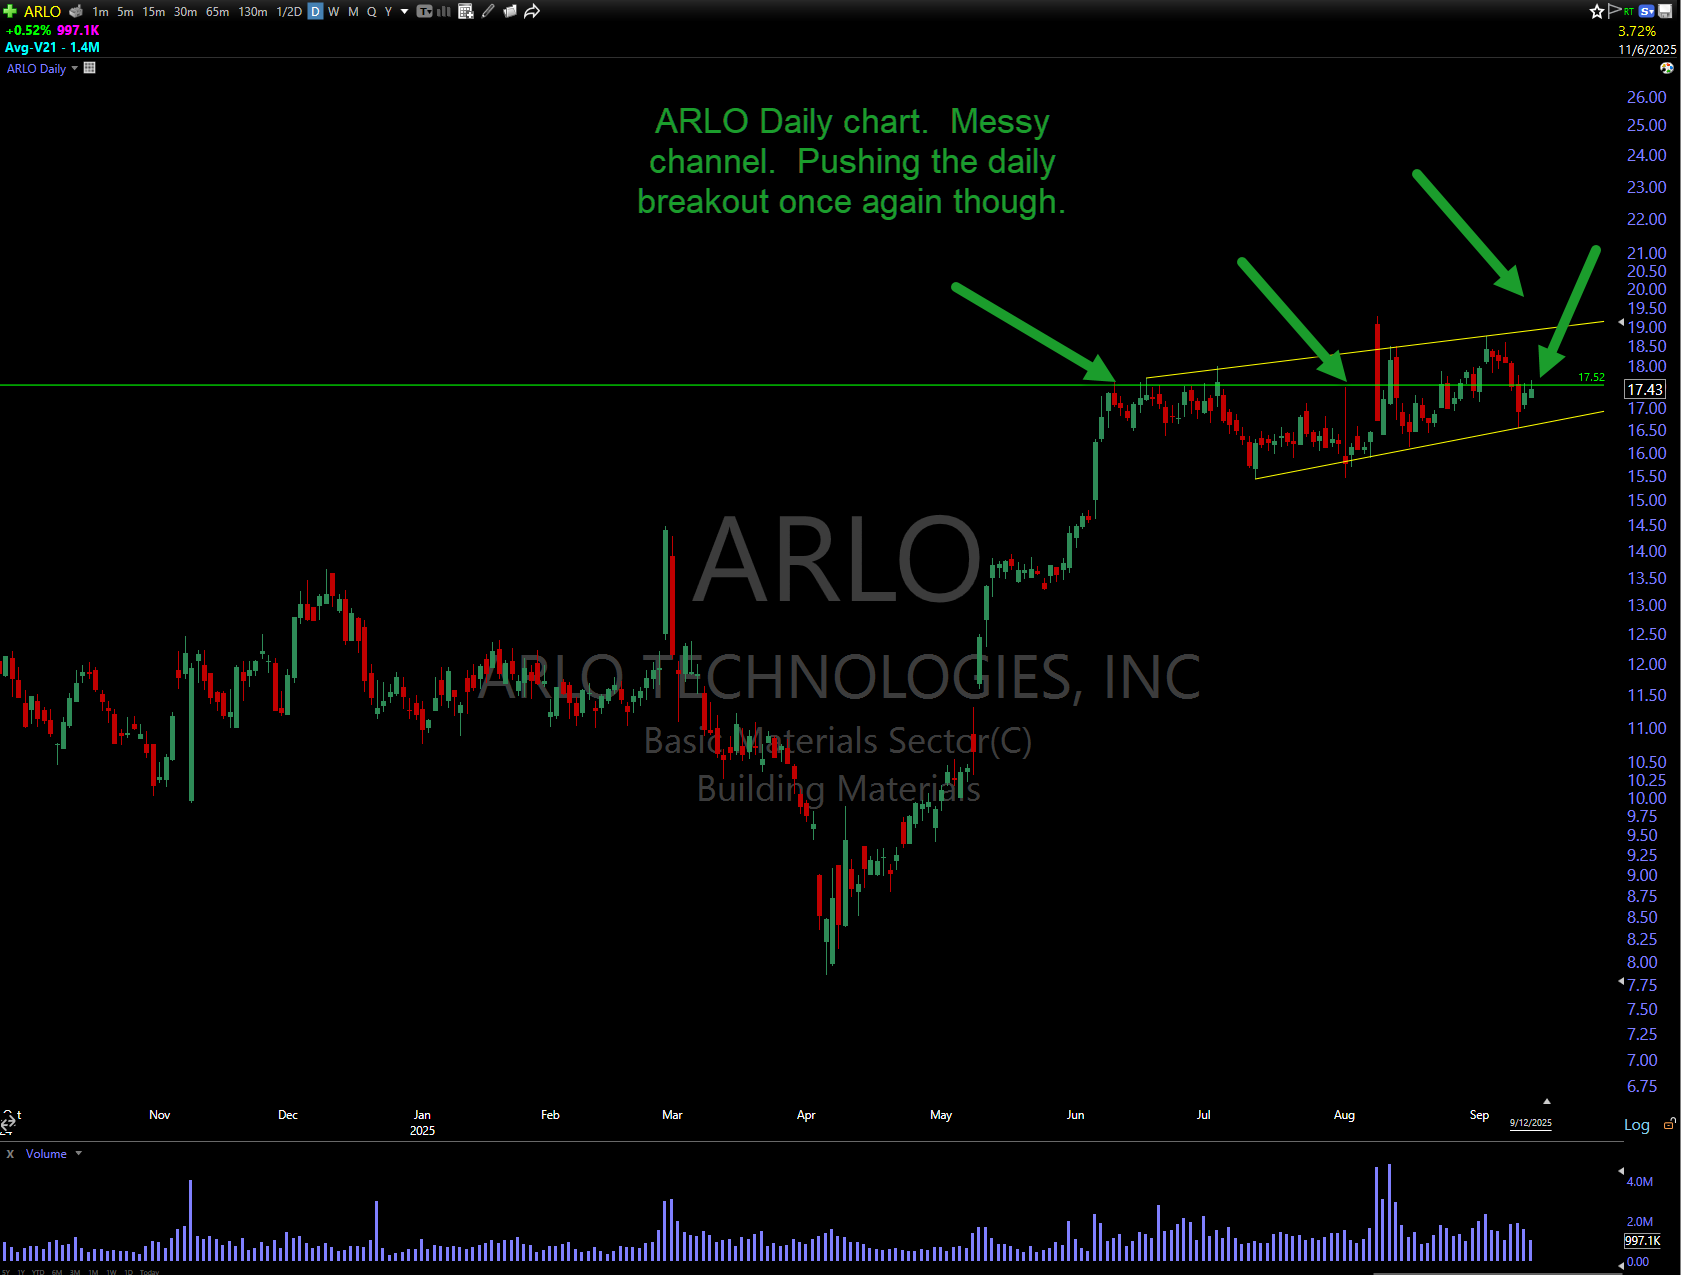
ARLO Daily chart above. Messy channel formed here. What I really notice is the green line. It was a previous high that's been tested ad-nauseam. Currently pushing up against it again.
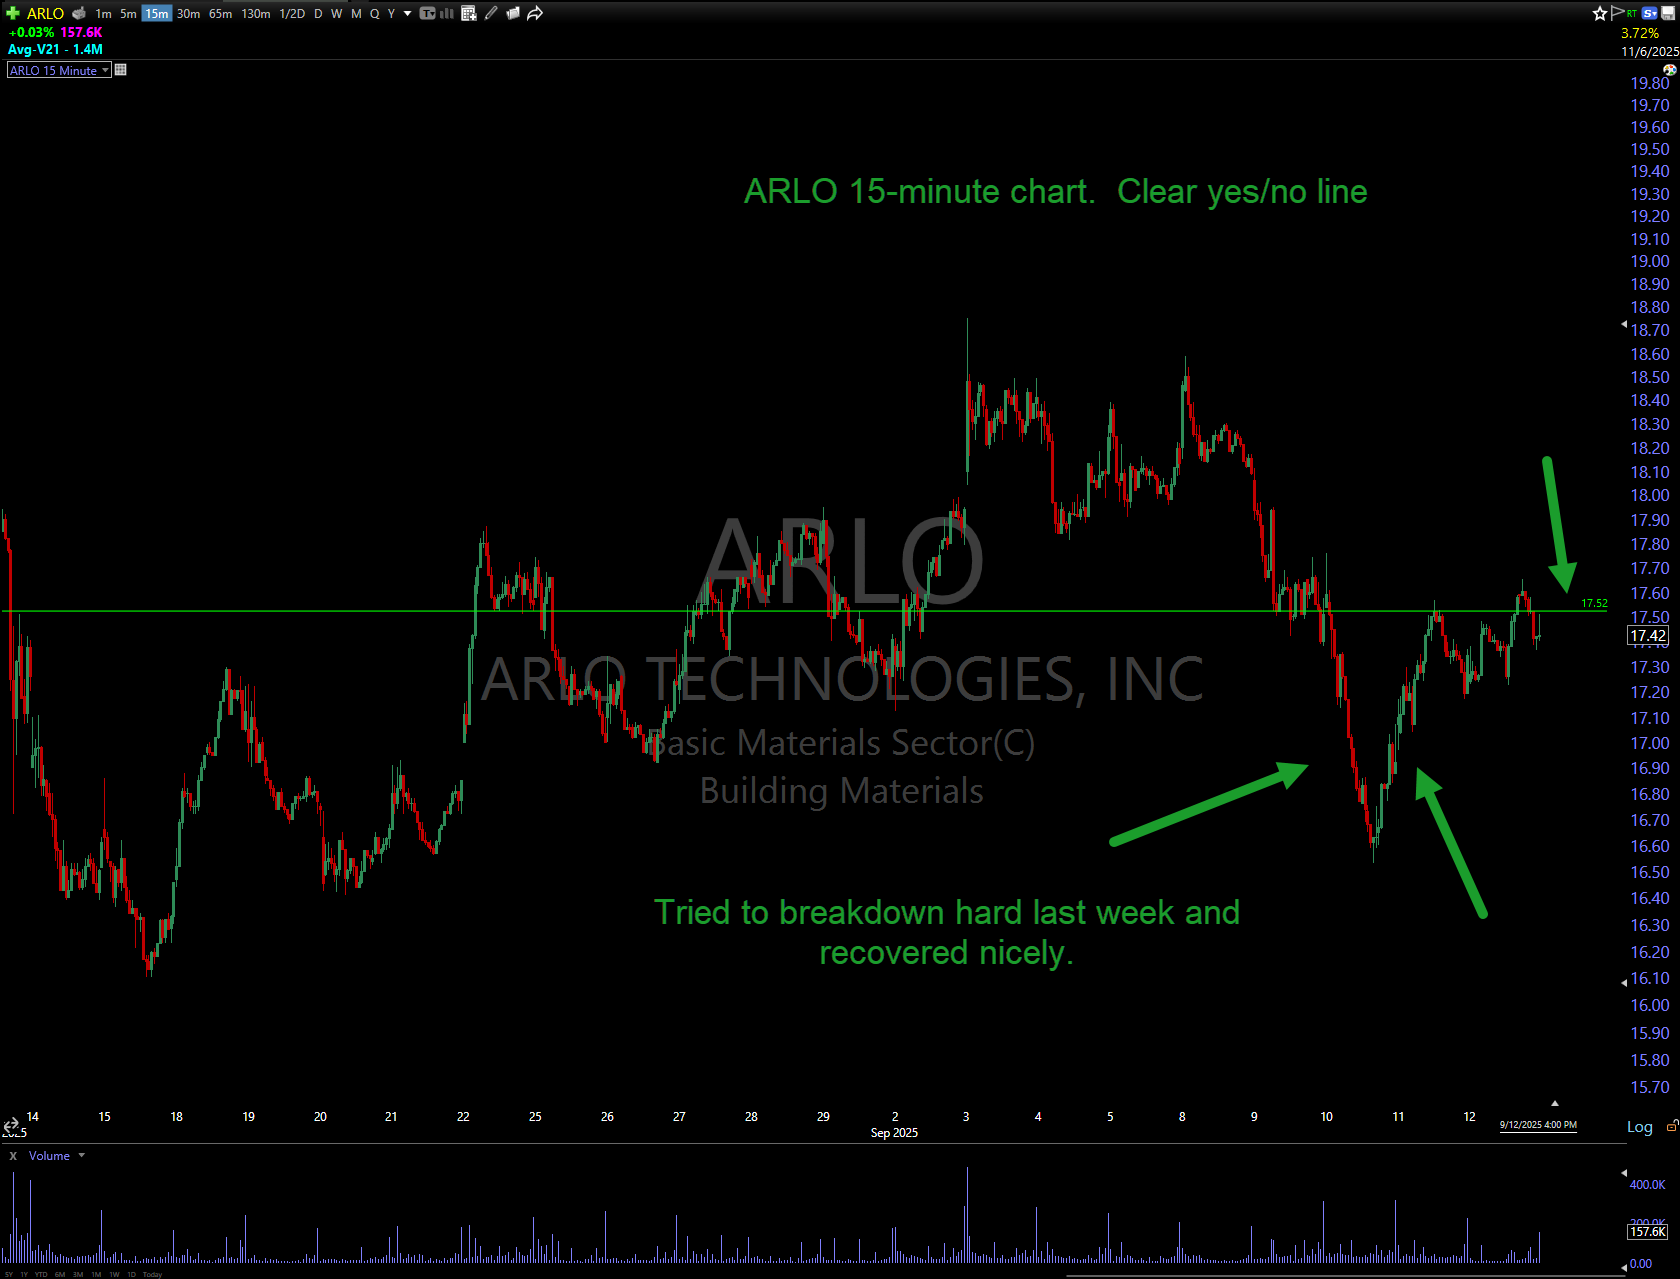
ARLO 15-minute chart above. Green line showing the yes/no line which was the previous high that it's been flirting with over and over.
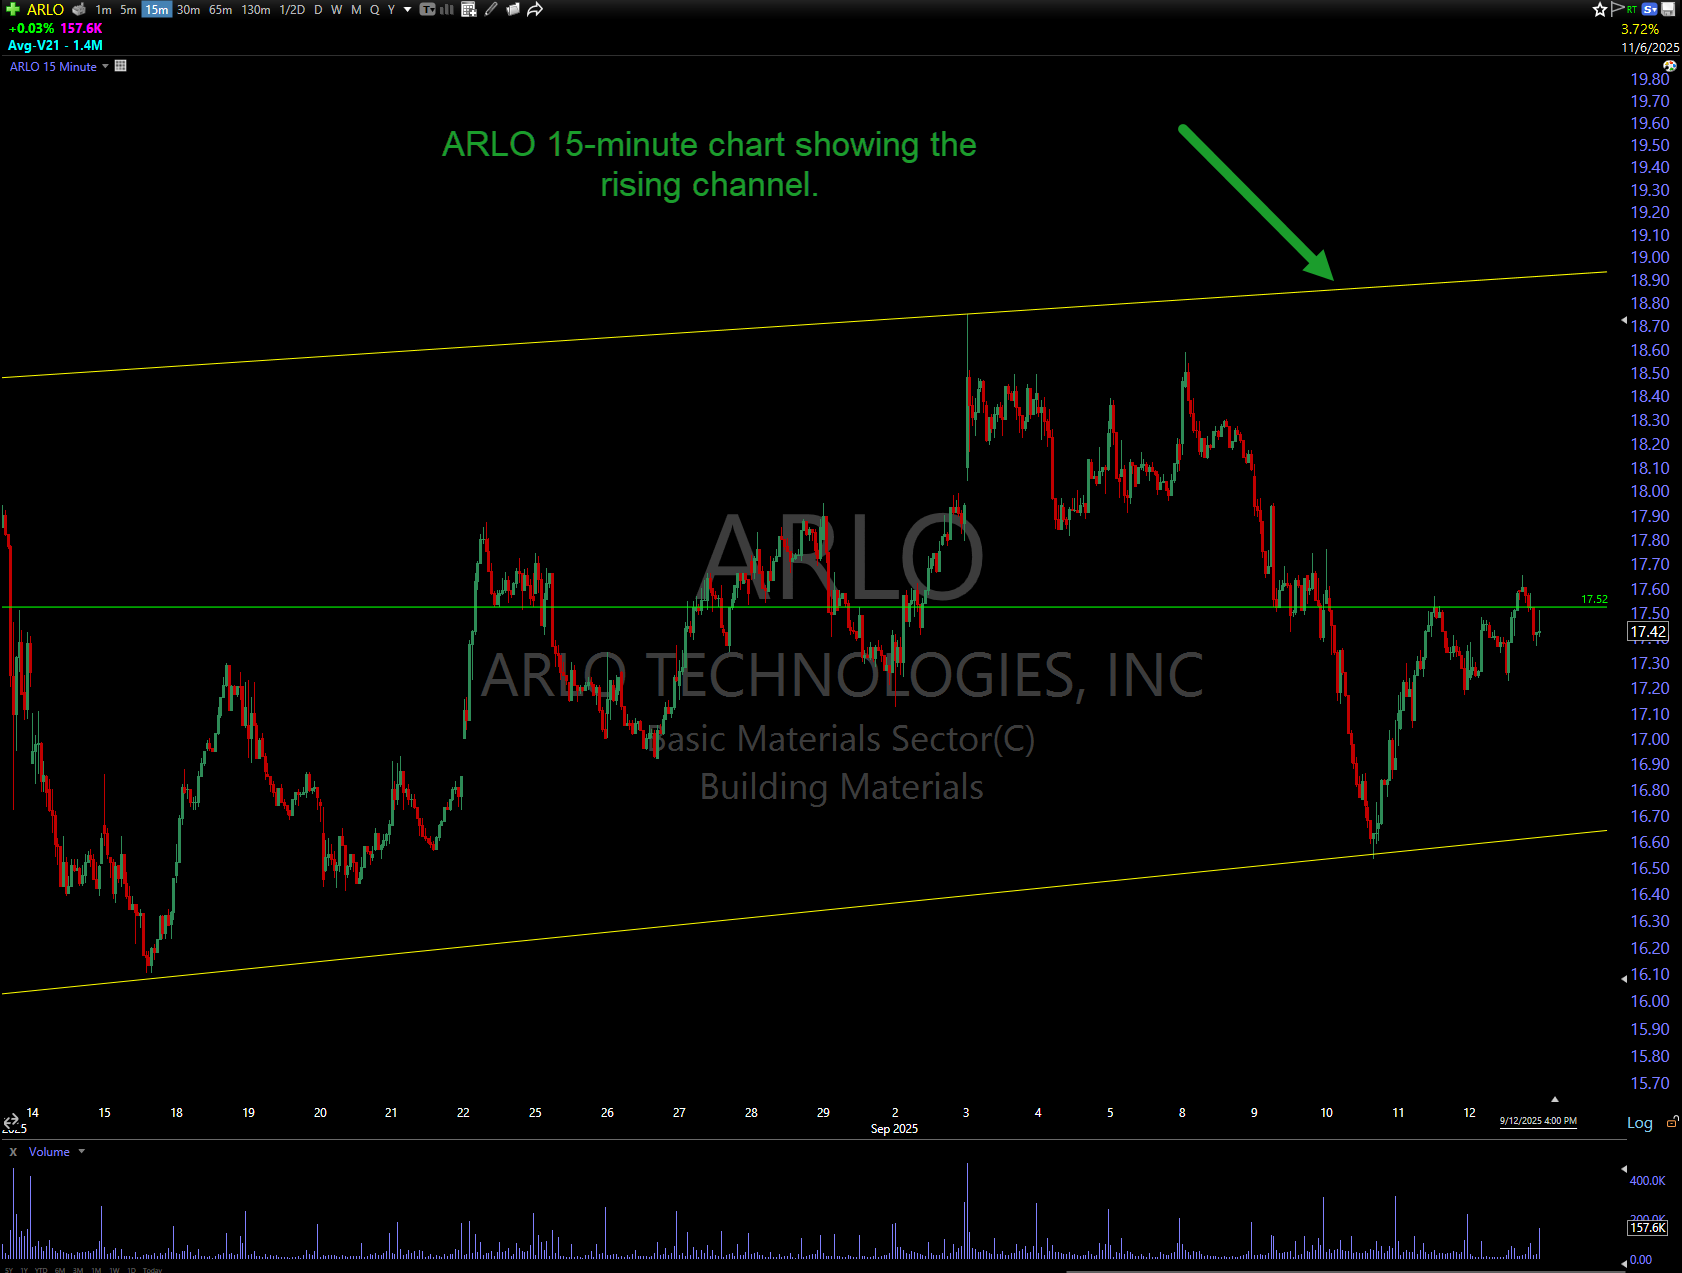
ARLO 15-minute chart with the rising channel shown. A high volume break of the green line would get me into the trade playing for a break of the higher time frame breakout (yellow rising channel).
CRMD
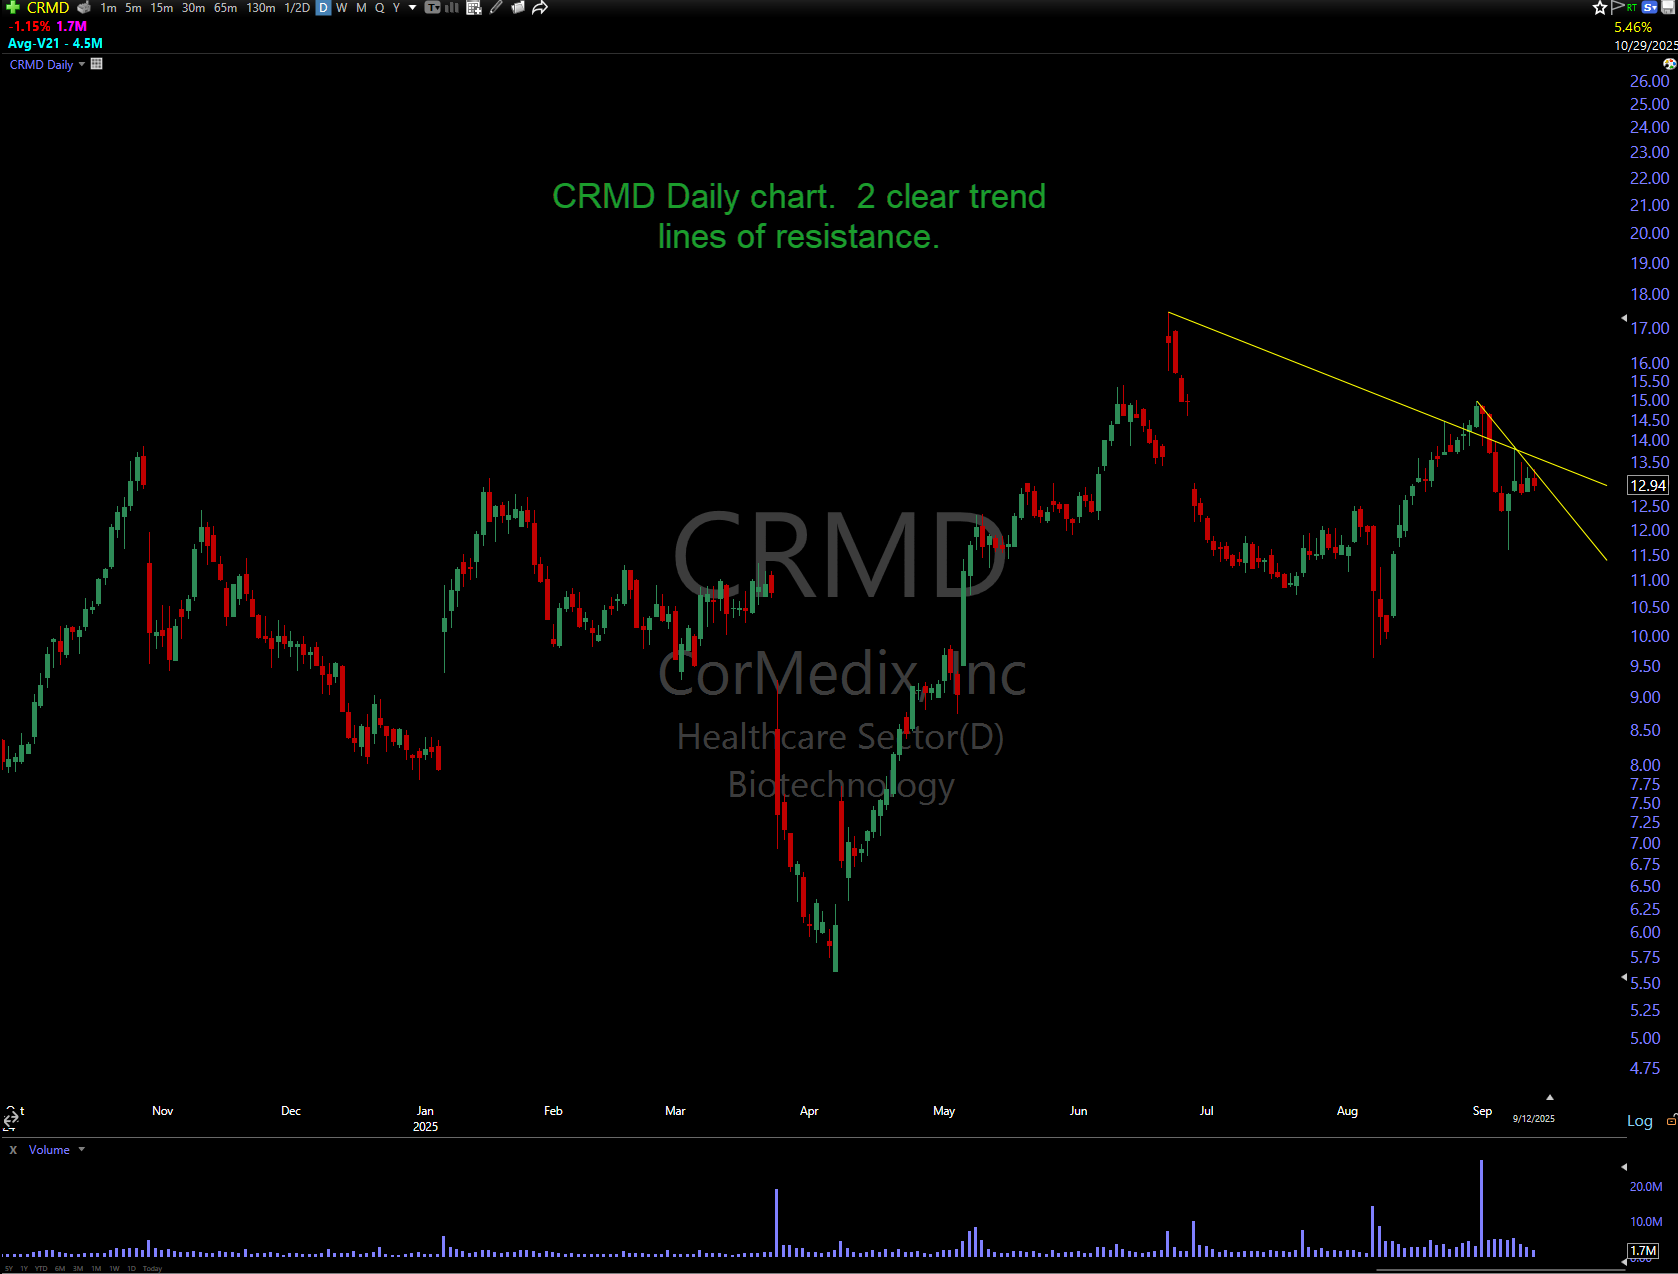
CRMD Daily. I'm not usually a big fan of biotech stocks, but this one really stood out. Made big move, then pulled back and found support. Now it's getting tight with decreasing volume.
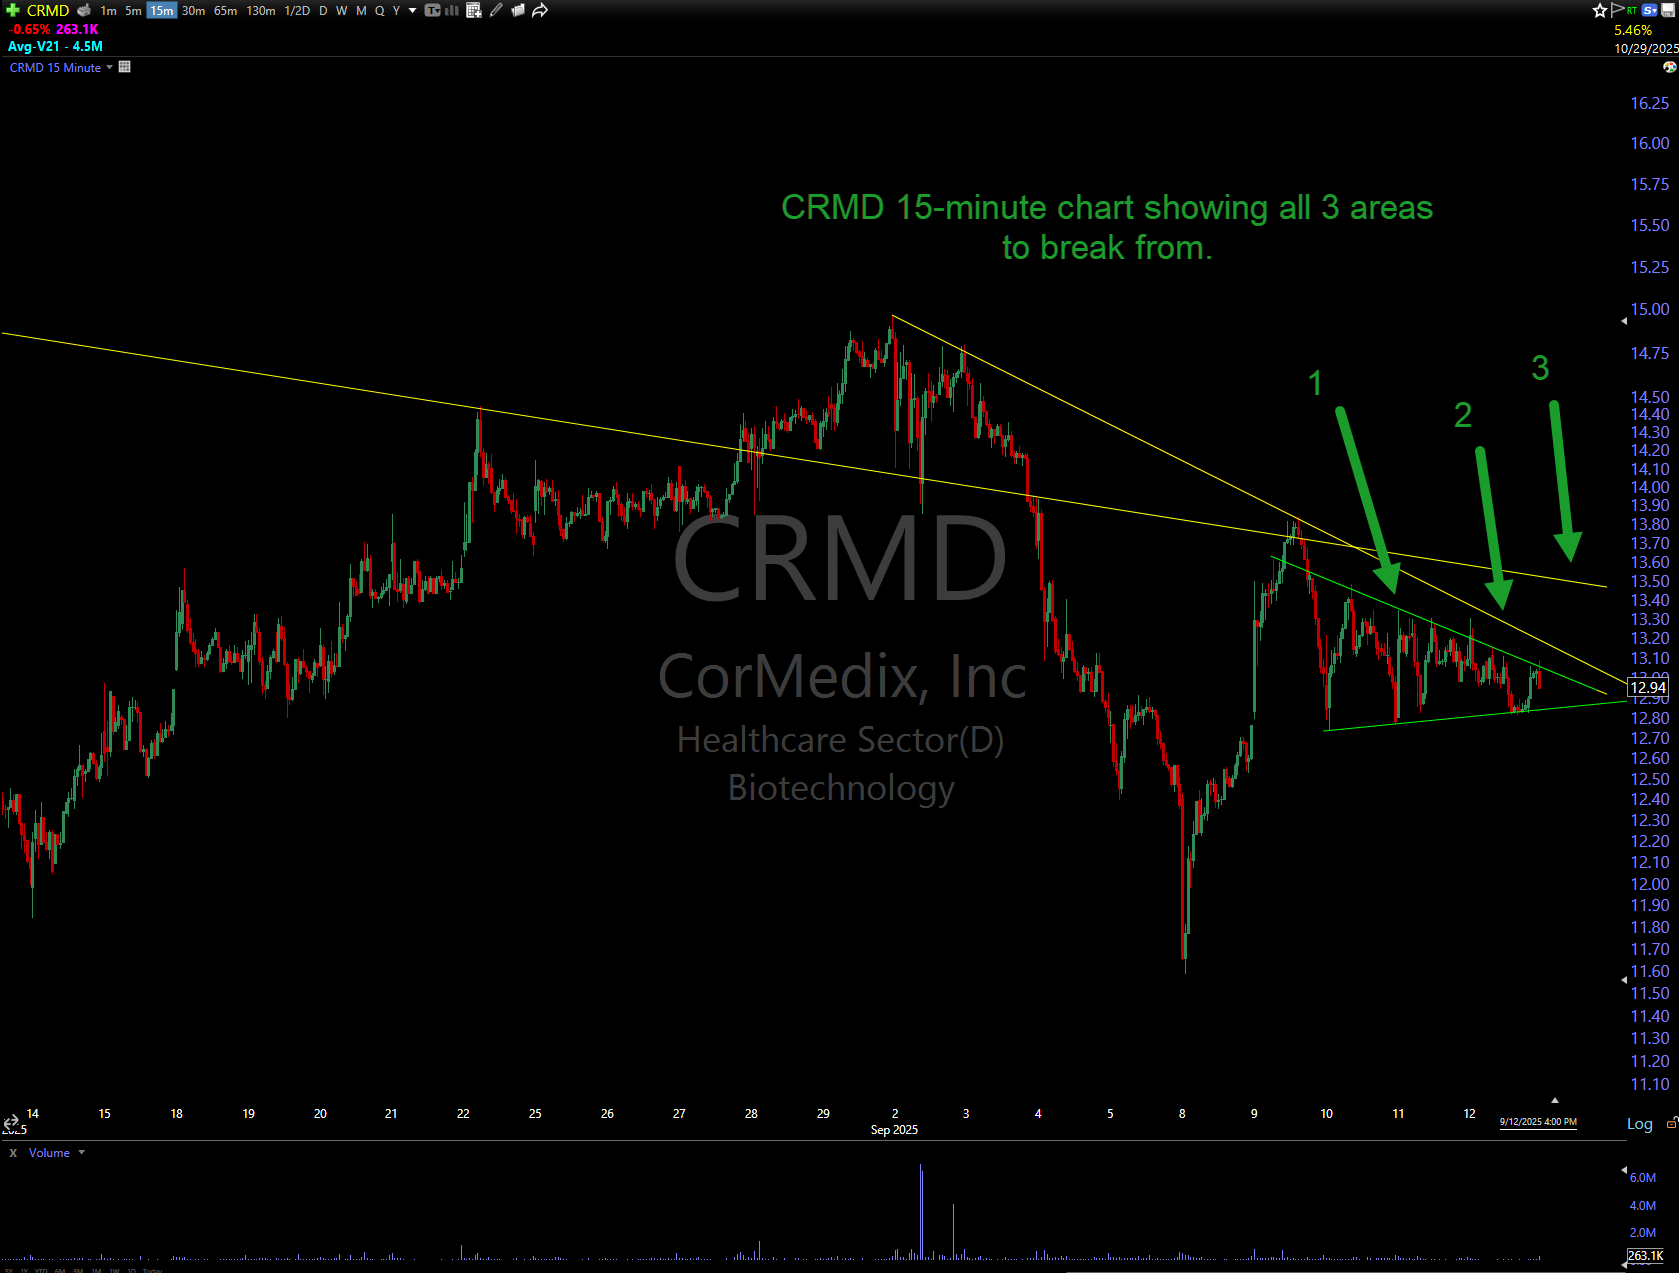
CRMD 15-minute chart. Three clear areas to break from. A high volume break above the #1 green line will get me into the trade. It's a great trade since, there's a very obvious stop point below the lower green line. A break above will play for the break of trends #2, and #3.
MGNI
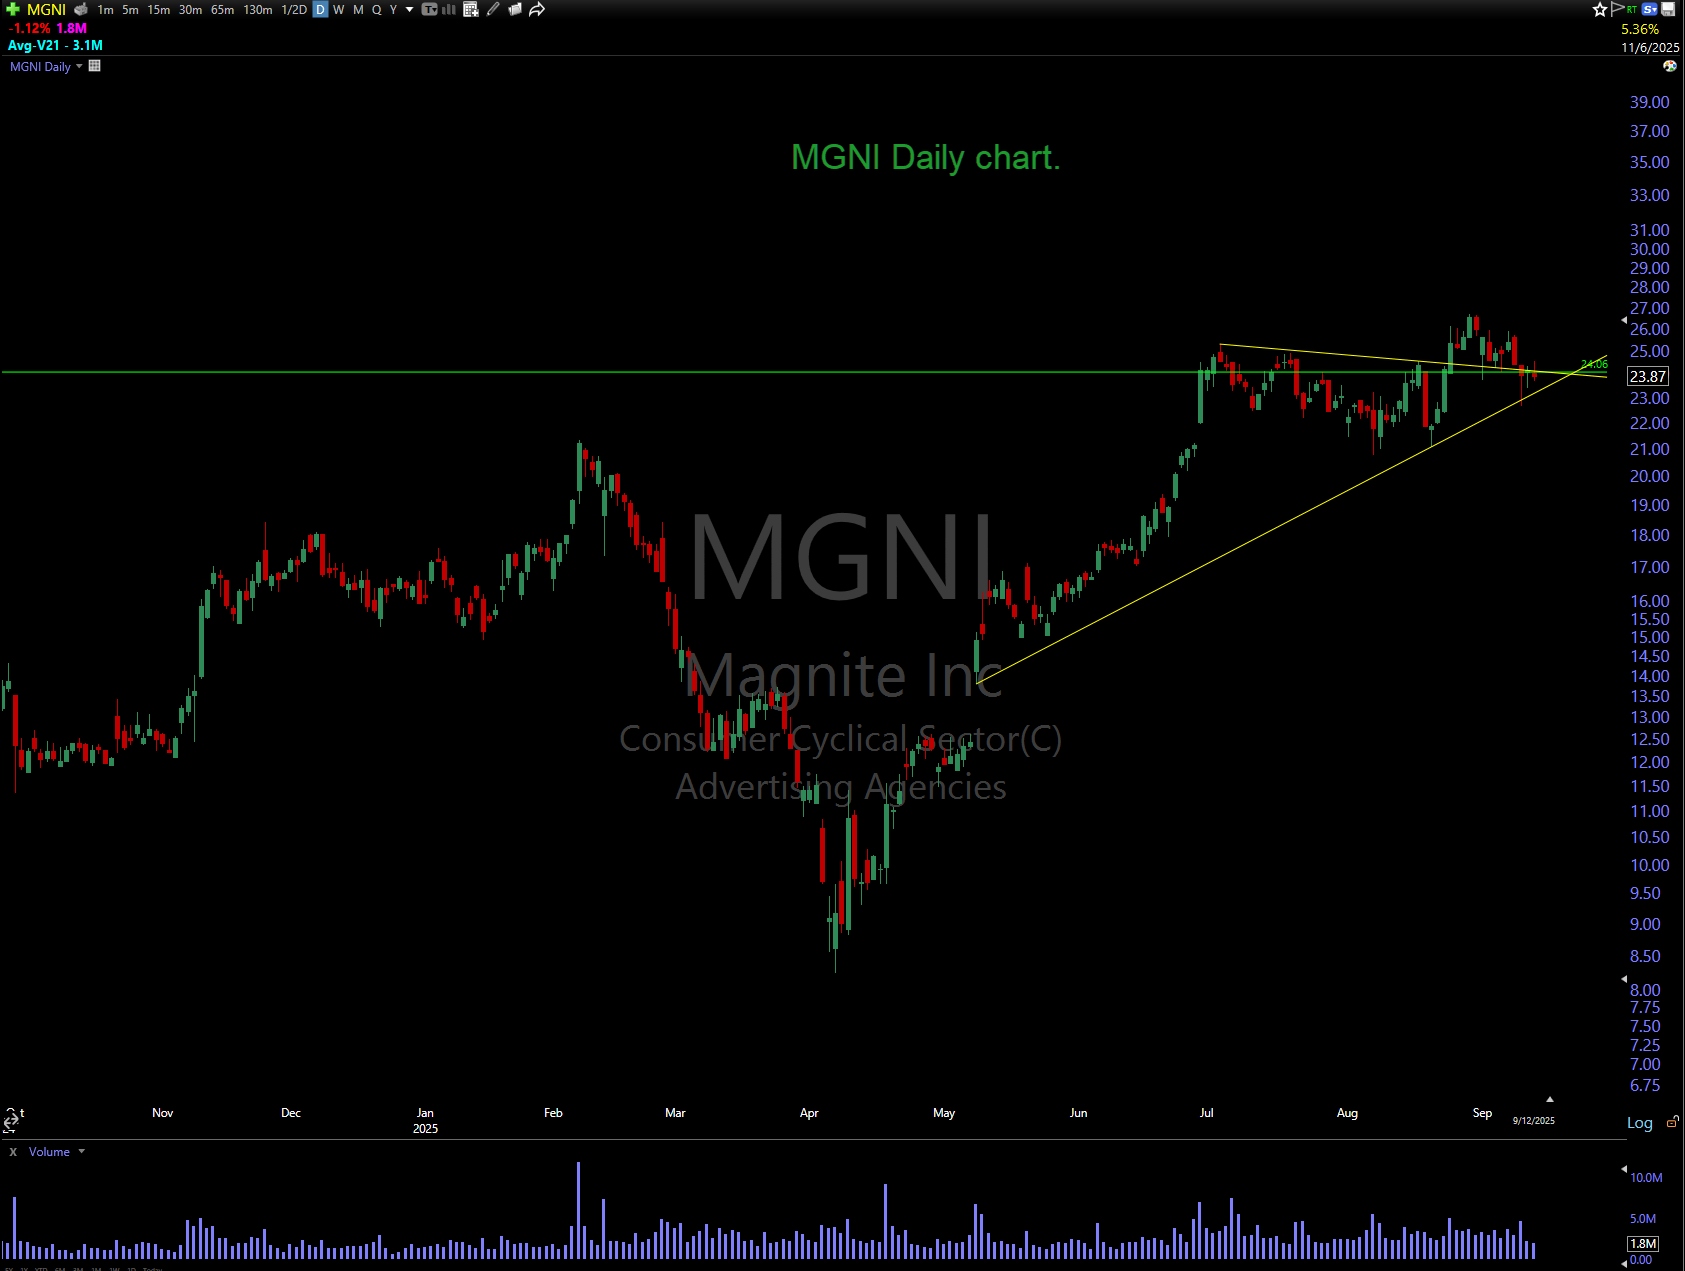
MGNI Daily. The top yellow and the green line are very interesting here. Showing a clear yes/no area that it needs to clear to explore higher.
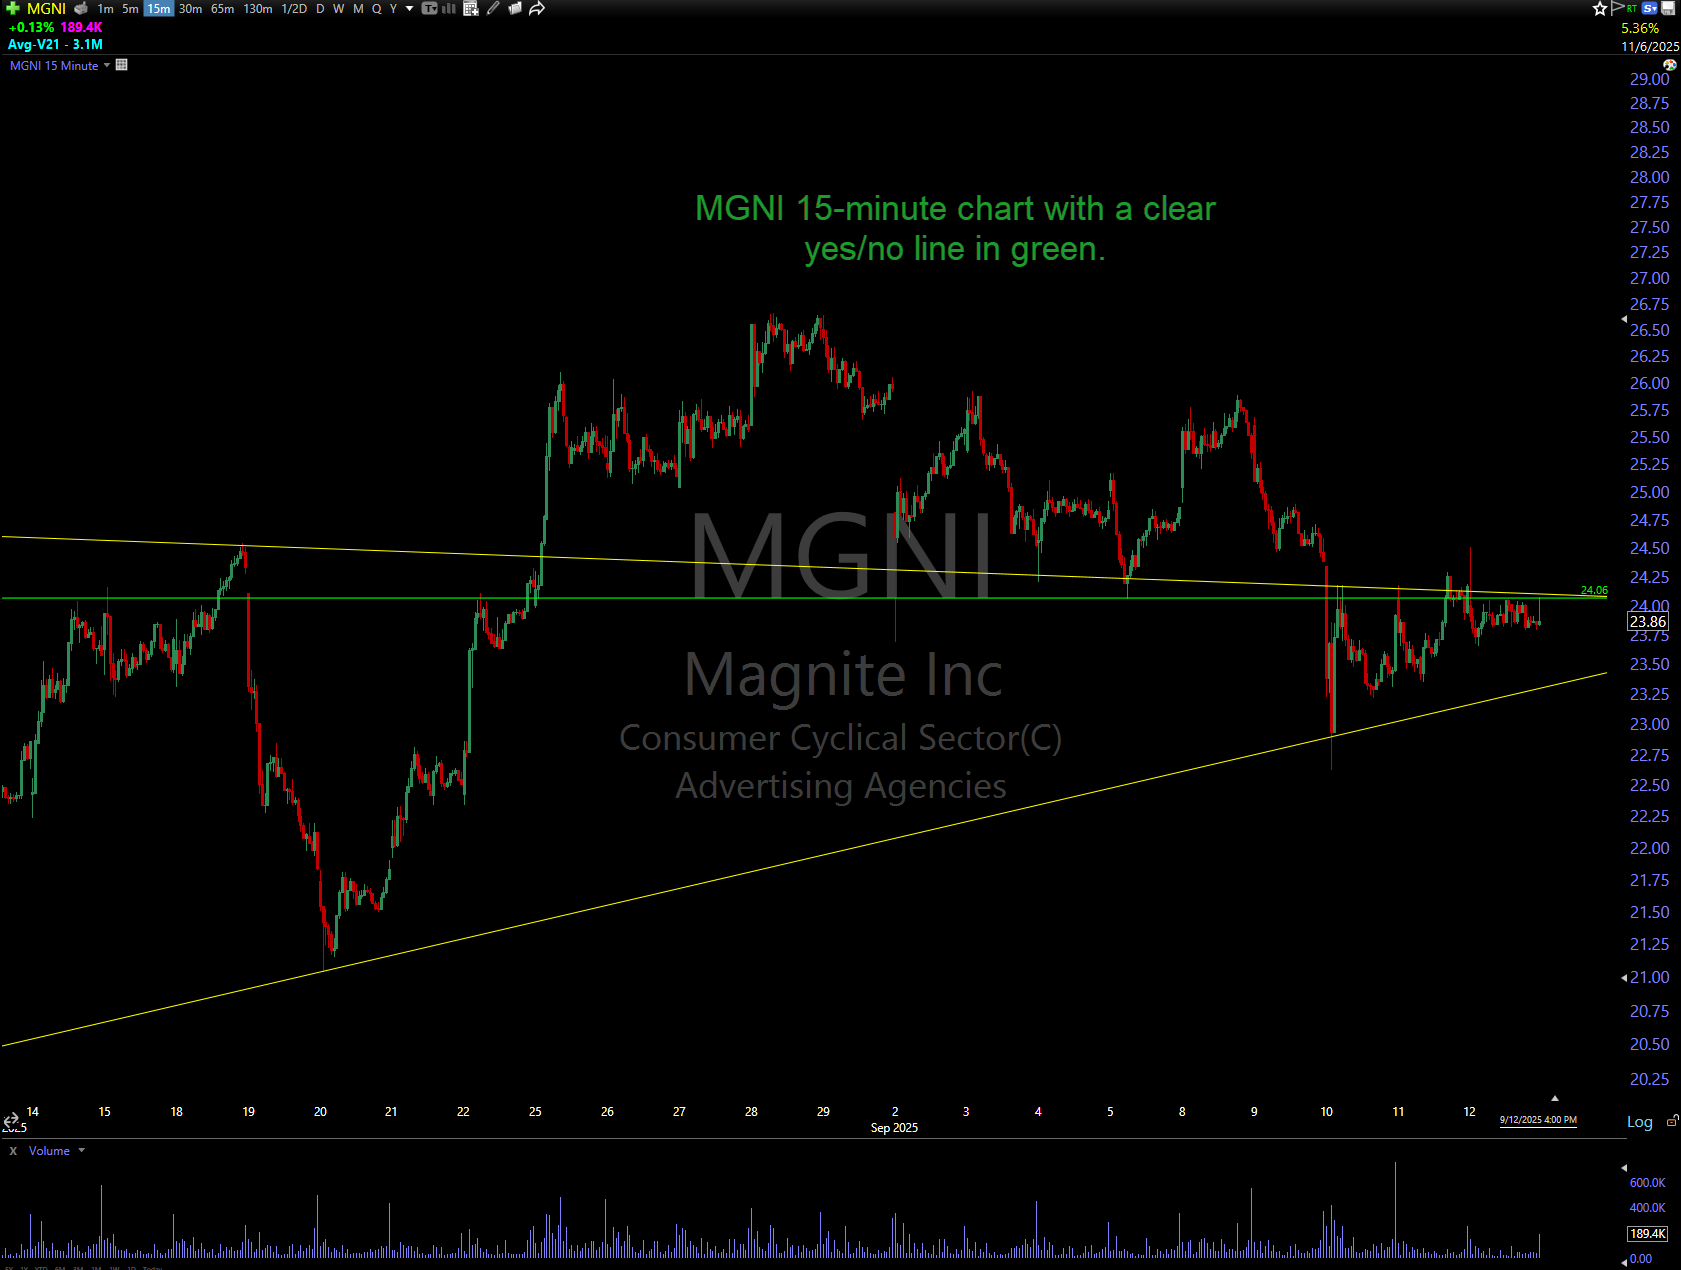
MGNI 15-minute chart above. Range is getting tight and also looking at the daily chart above - the volume is dropping. A high volume break above the green line will get me into this trade.
PCT
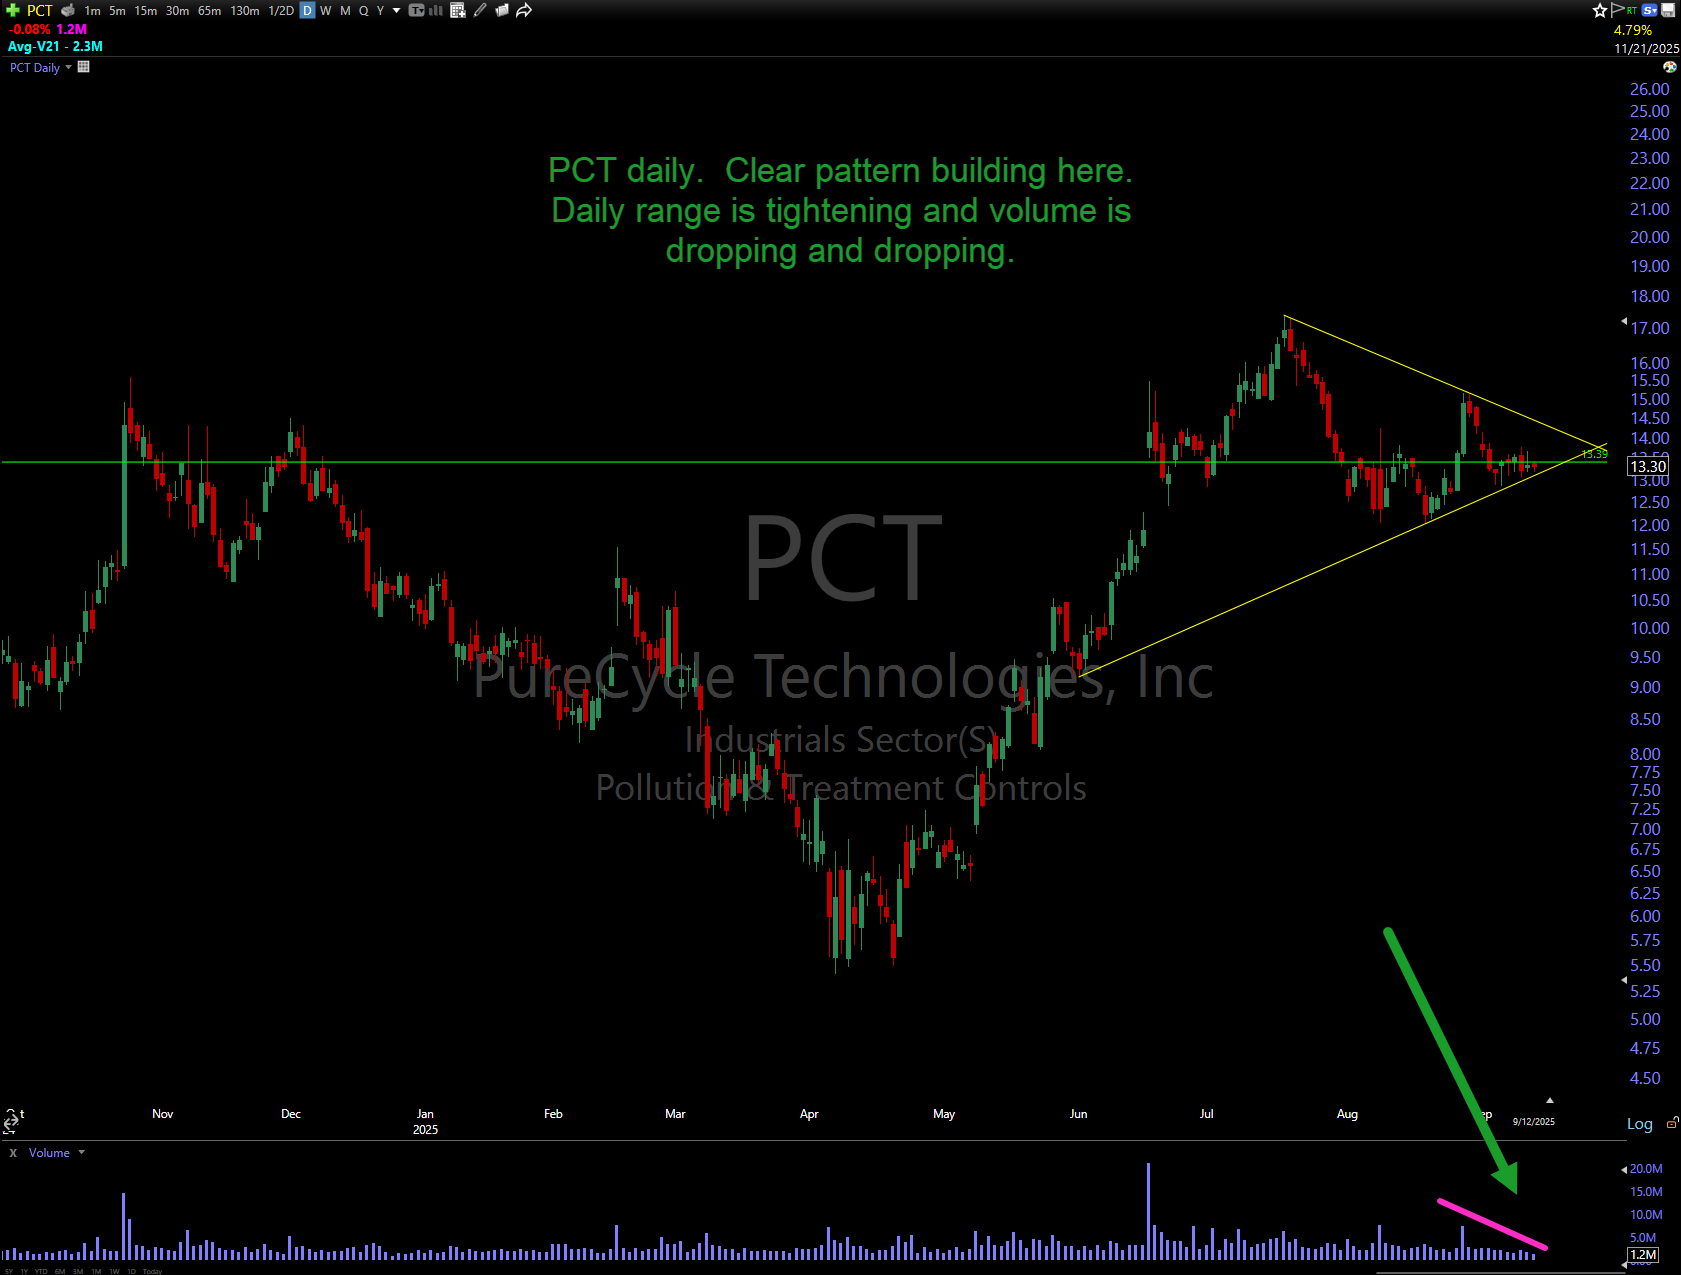
PCT daily chart. Clear pattern forming here. Range is getting tight and volume is dropping.
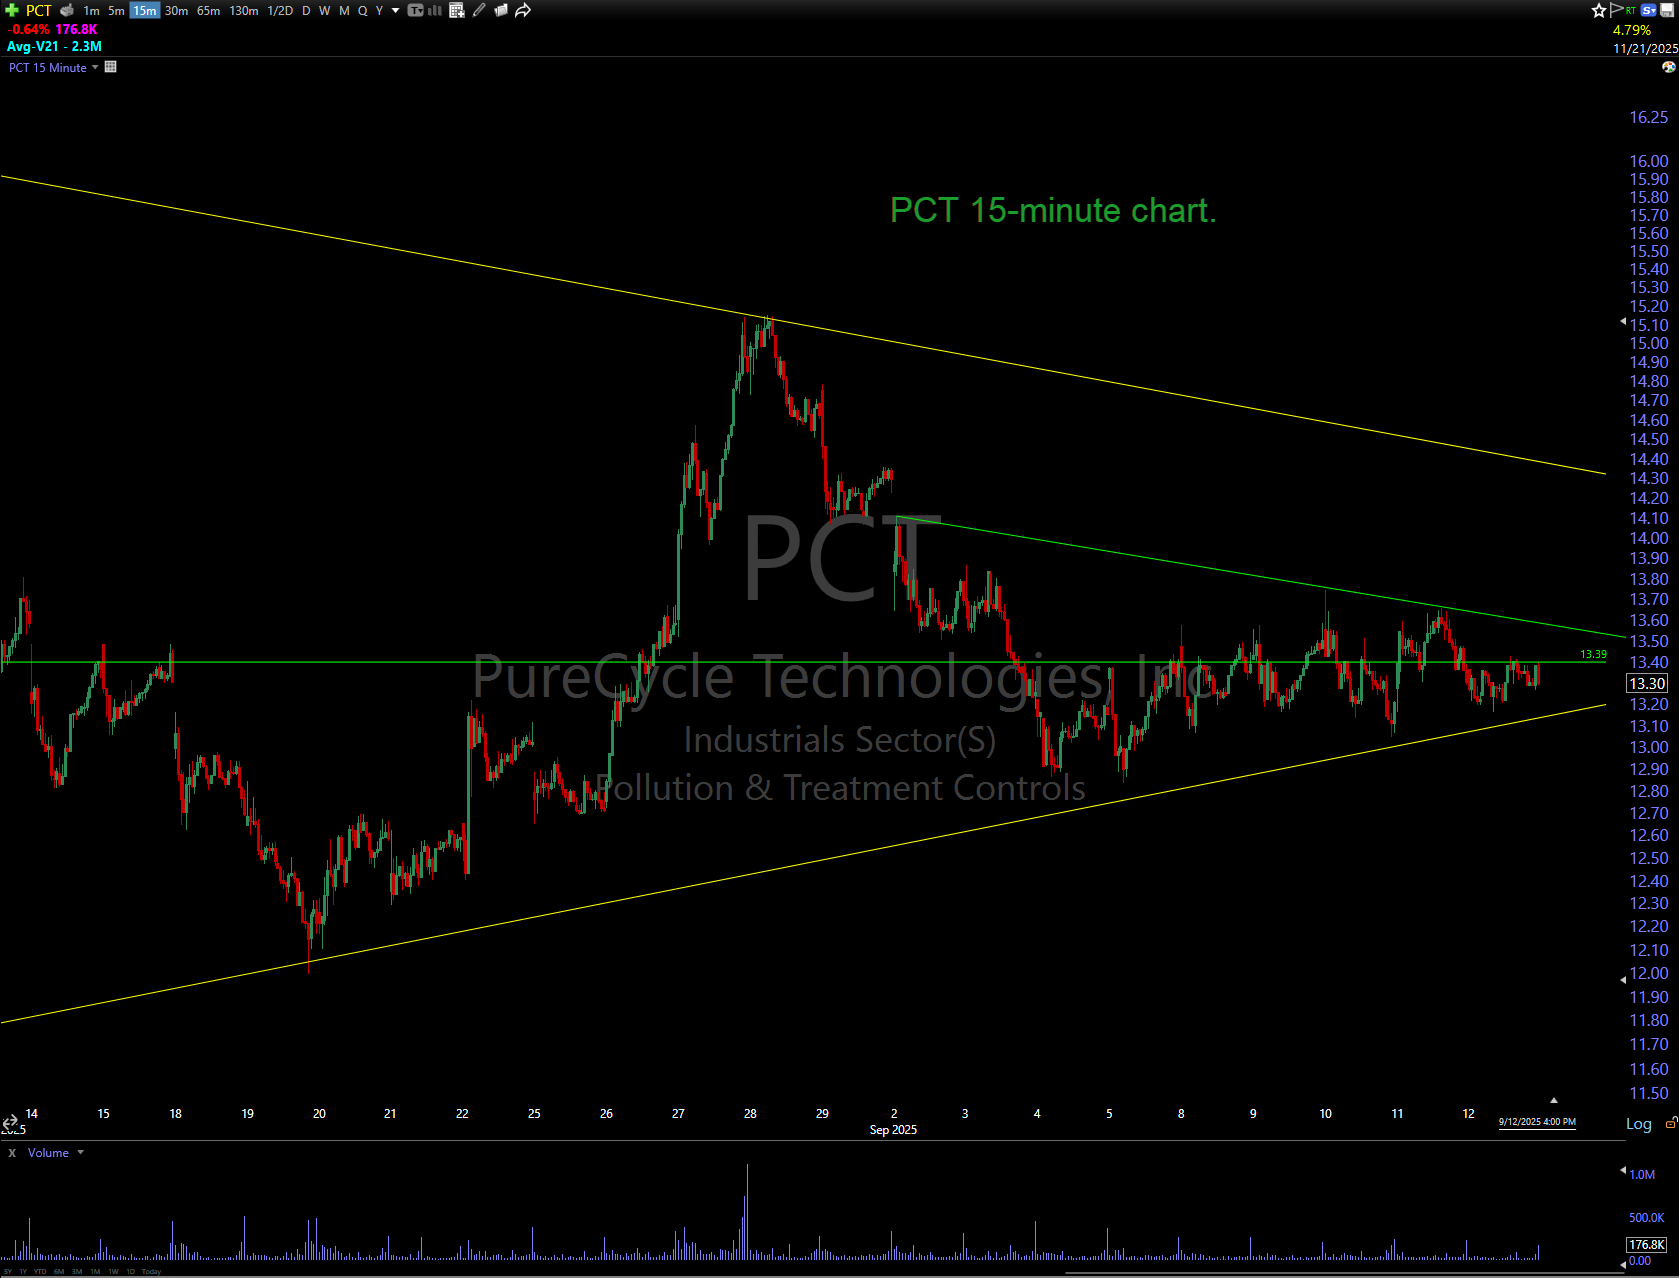
PCT 15-minute chart. Horizontal yes/no line showing what's needed to explore higher. A high volume break above will get me into this trade playing for a test and break above the yellow above.
PLUG
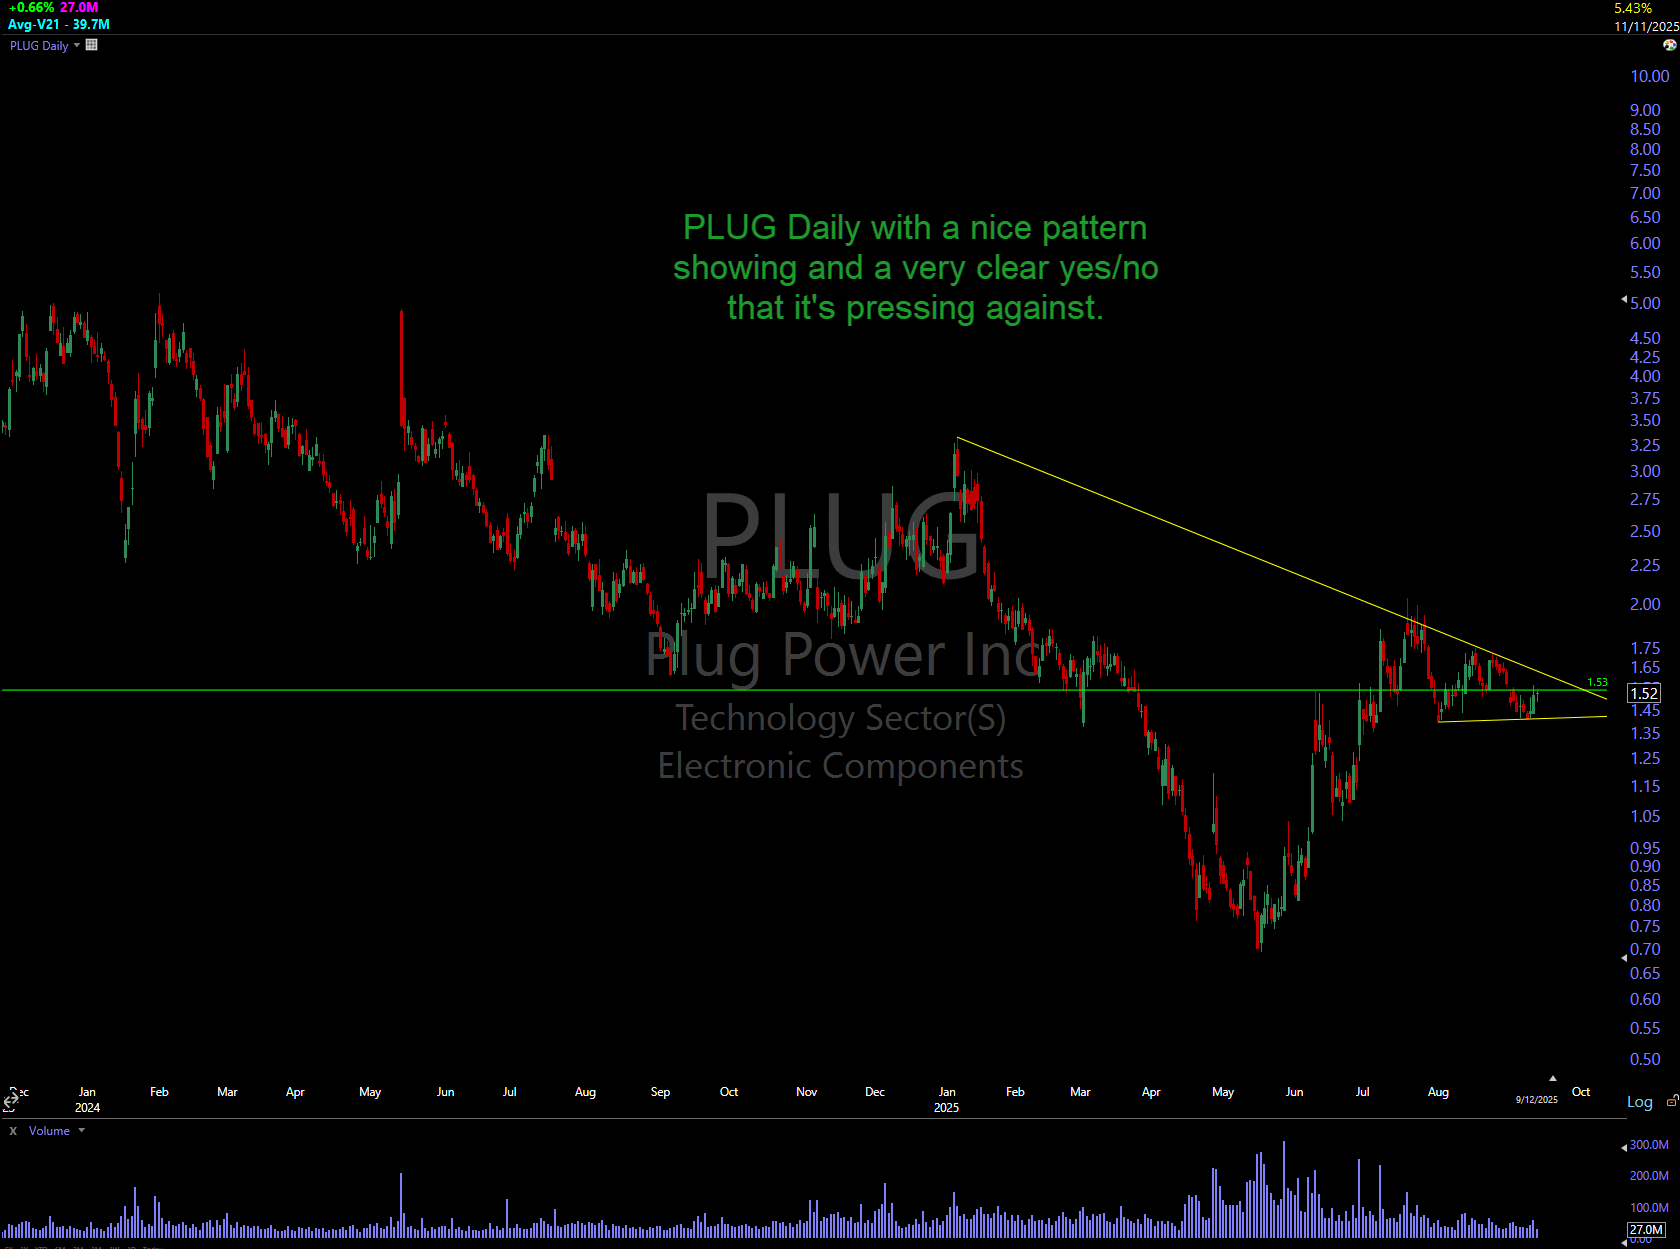
PLUG Daily chart above. Showing a clear pattern and yes/no line needed to overcome for higher prices.
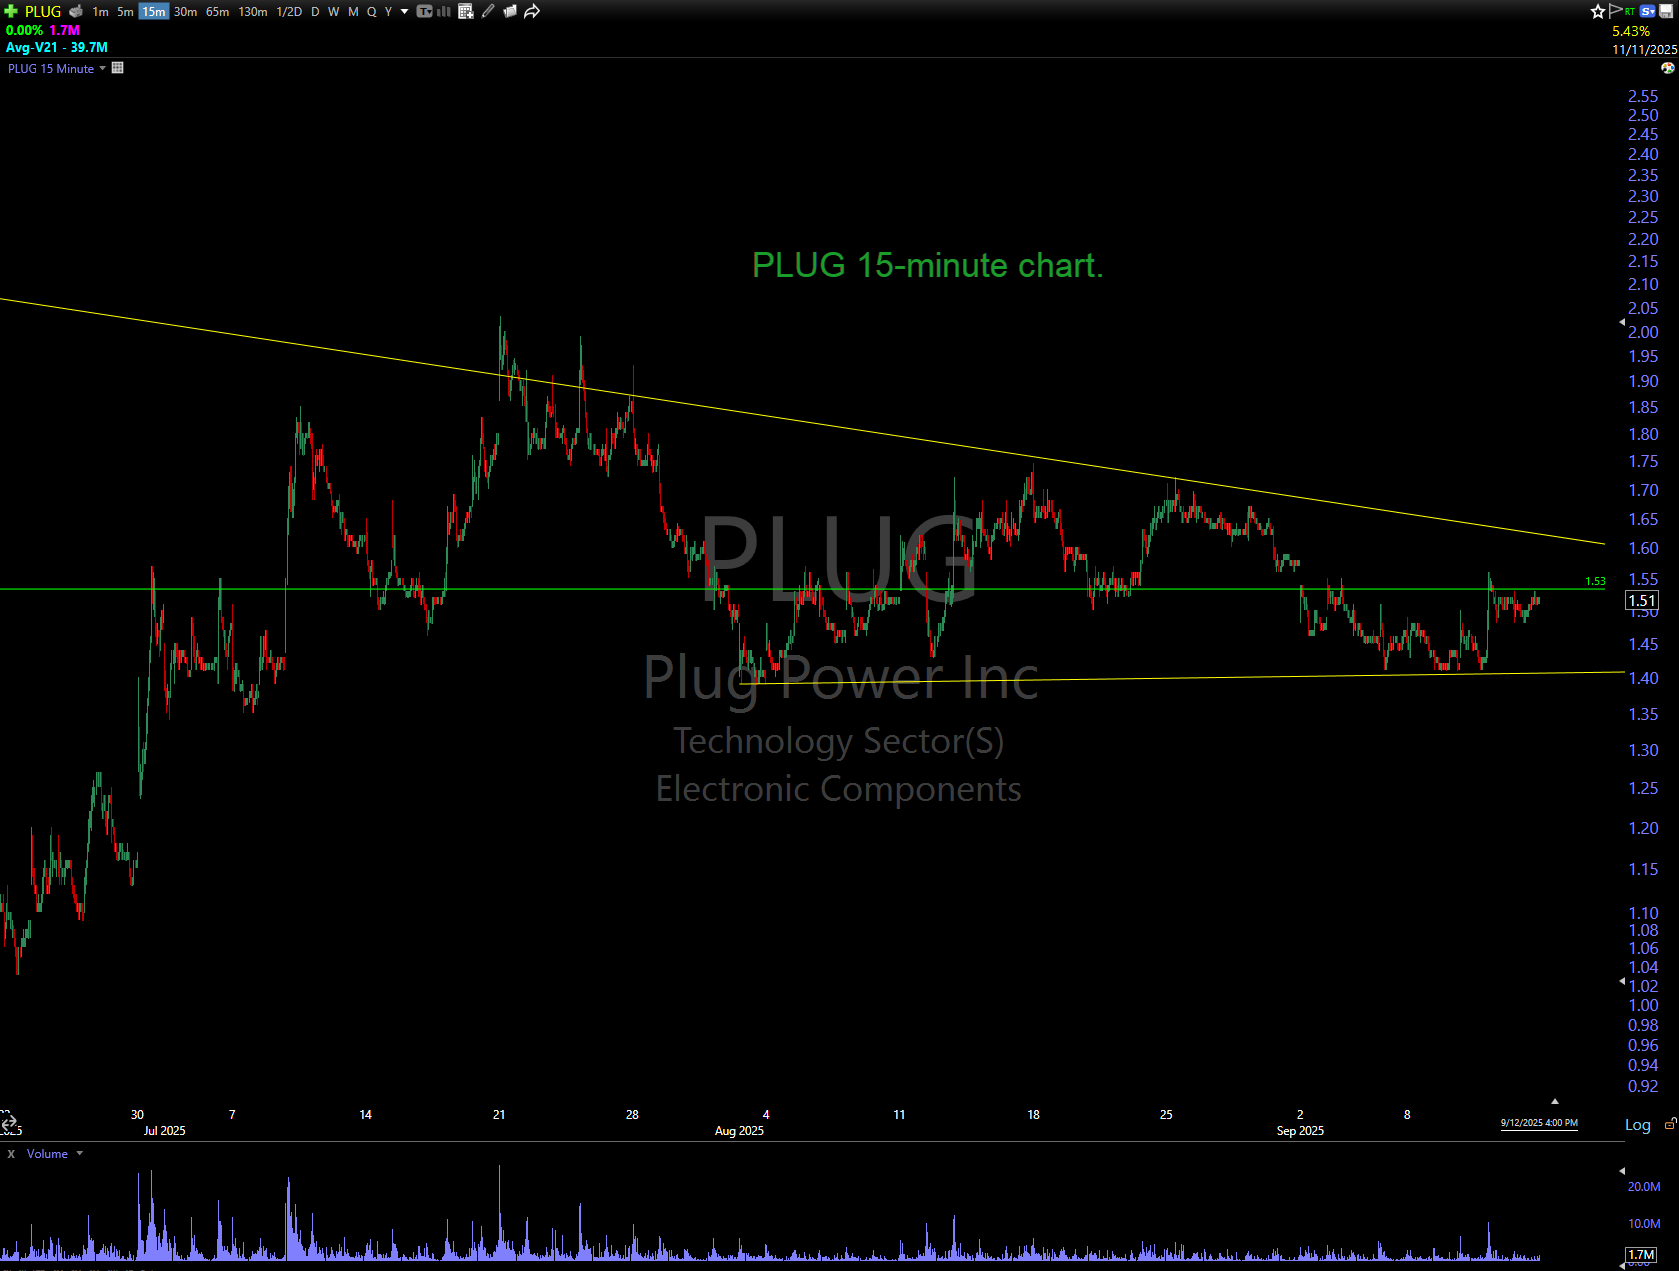
PLUG 15-minute chart above. High volume break above the green line will get me into this trade playing for a breakout above the higher time frame yellow trend line above.
AMD
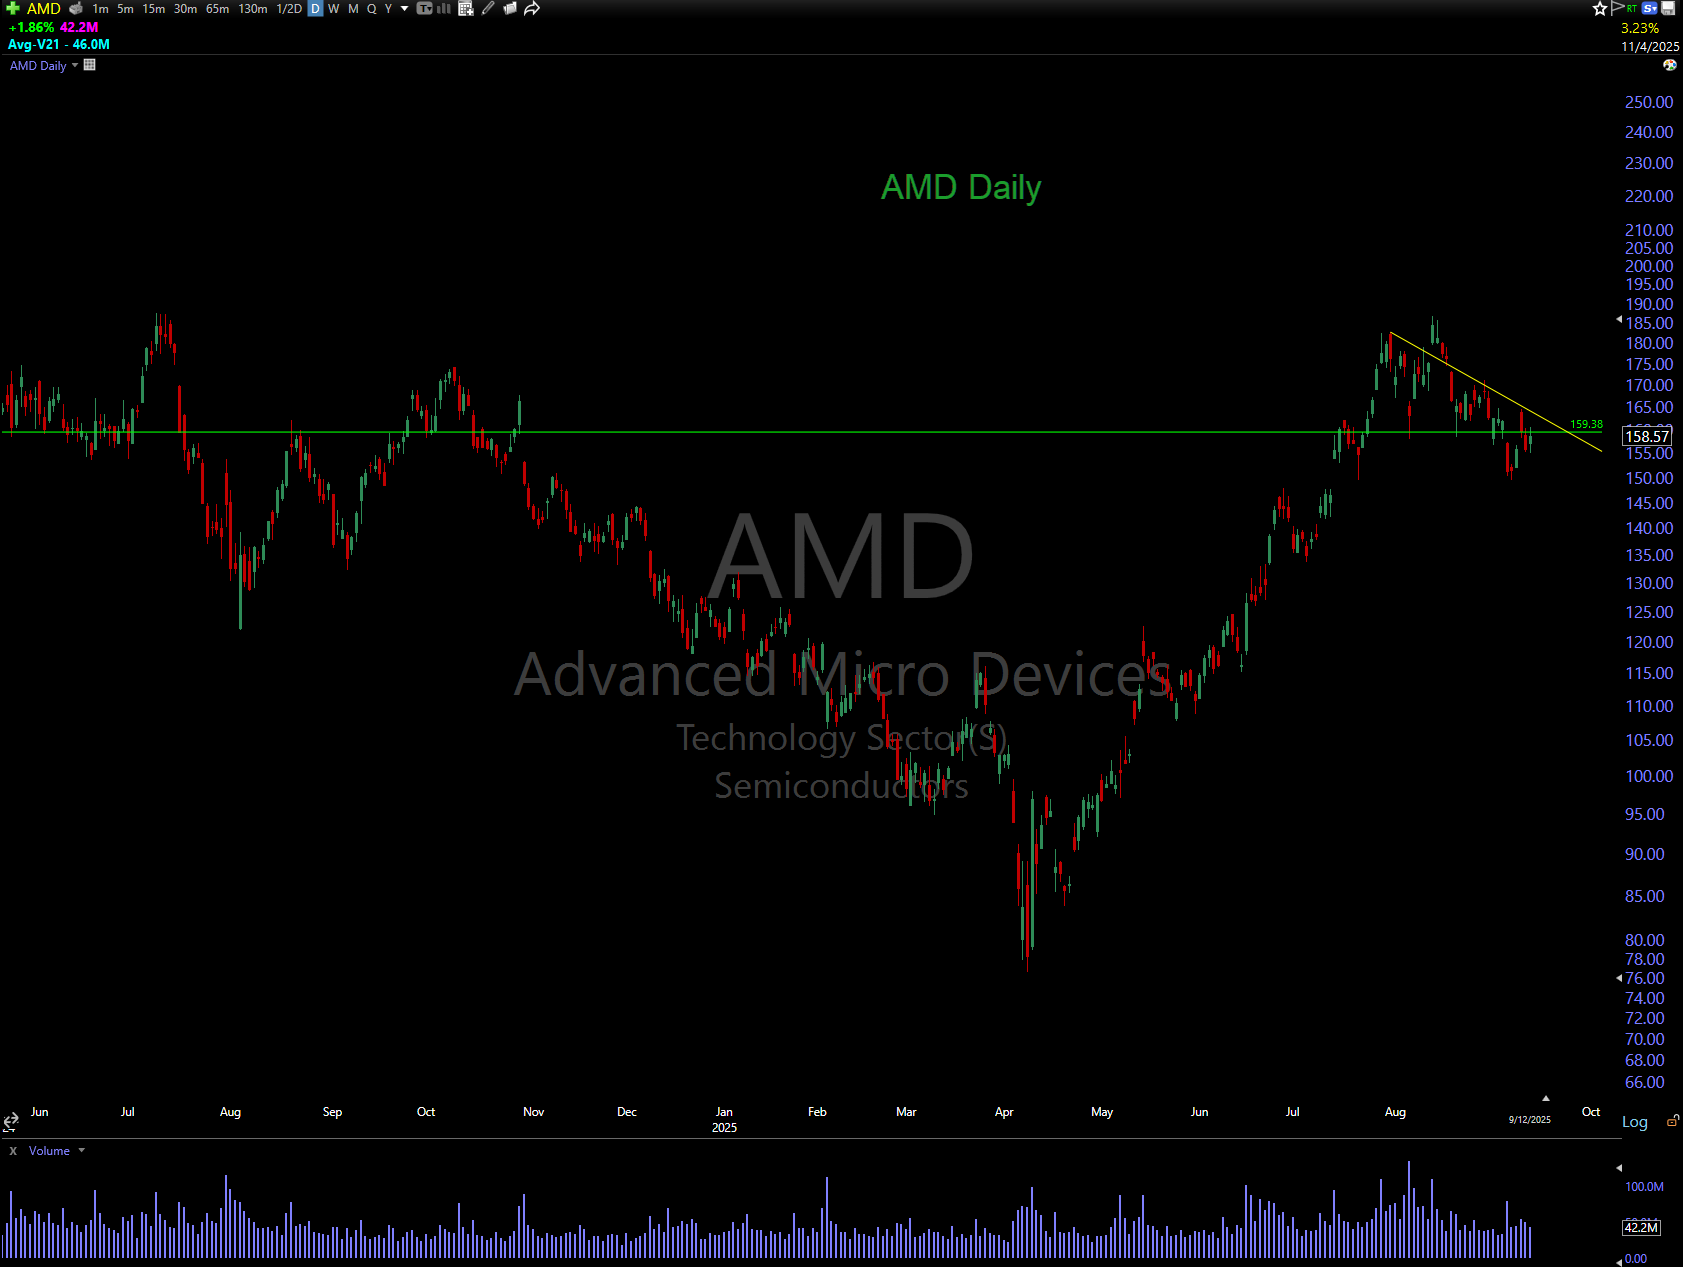
AMD Daily above. Been digesting the massive move.
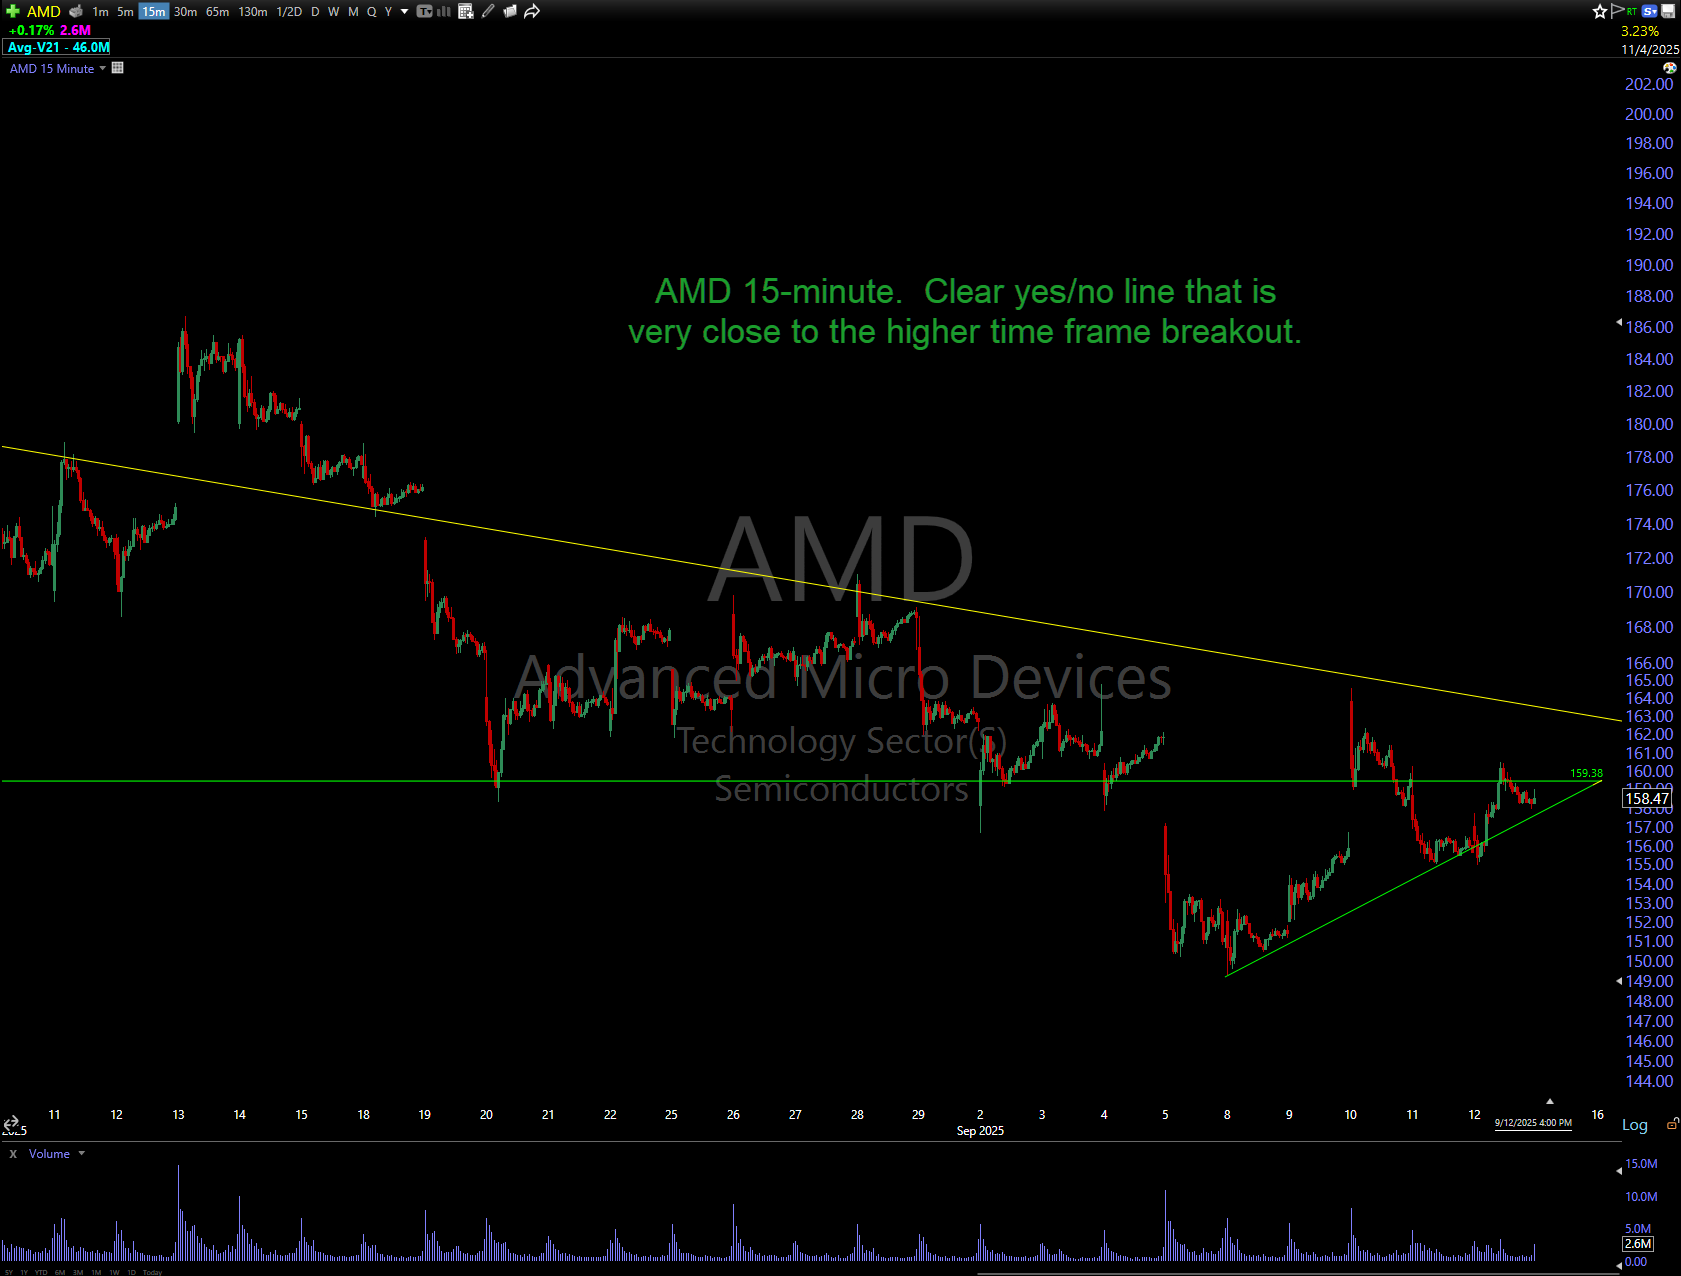
AMD 15-minute above. The green yes/no line is make or break for higher prices and a change to breakout on the daily yellow line. A high volume break above the yes/no line will get me into the trade. Clear "I'm wrong" below the lower trend line. I would not stop out right away if price explores below - I'd monitor and see if it's a fake out.
AAP
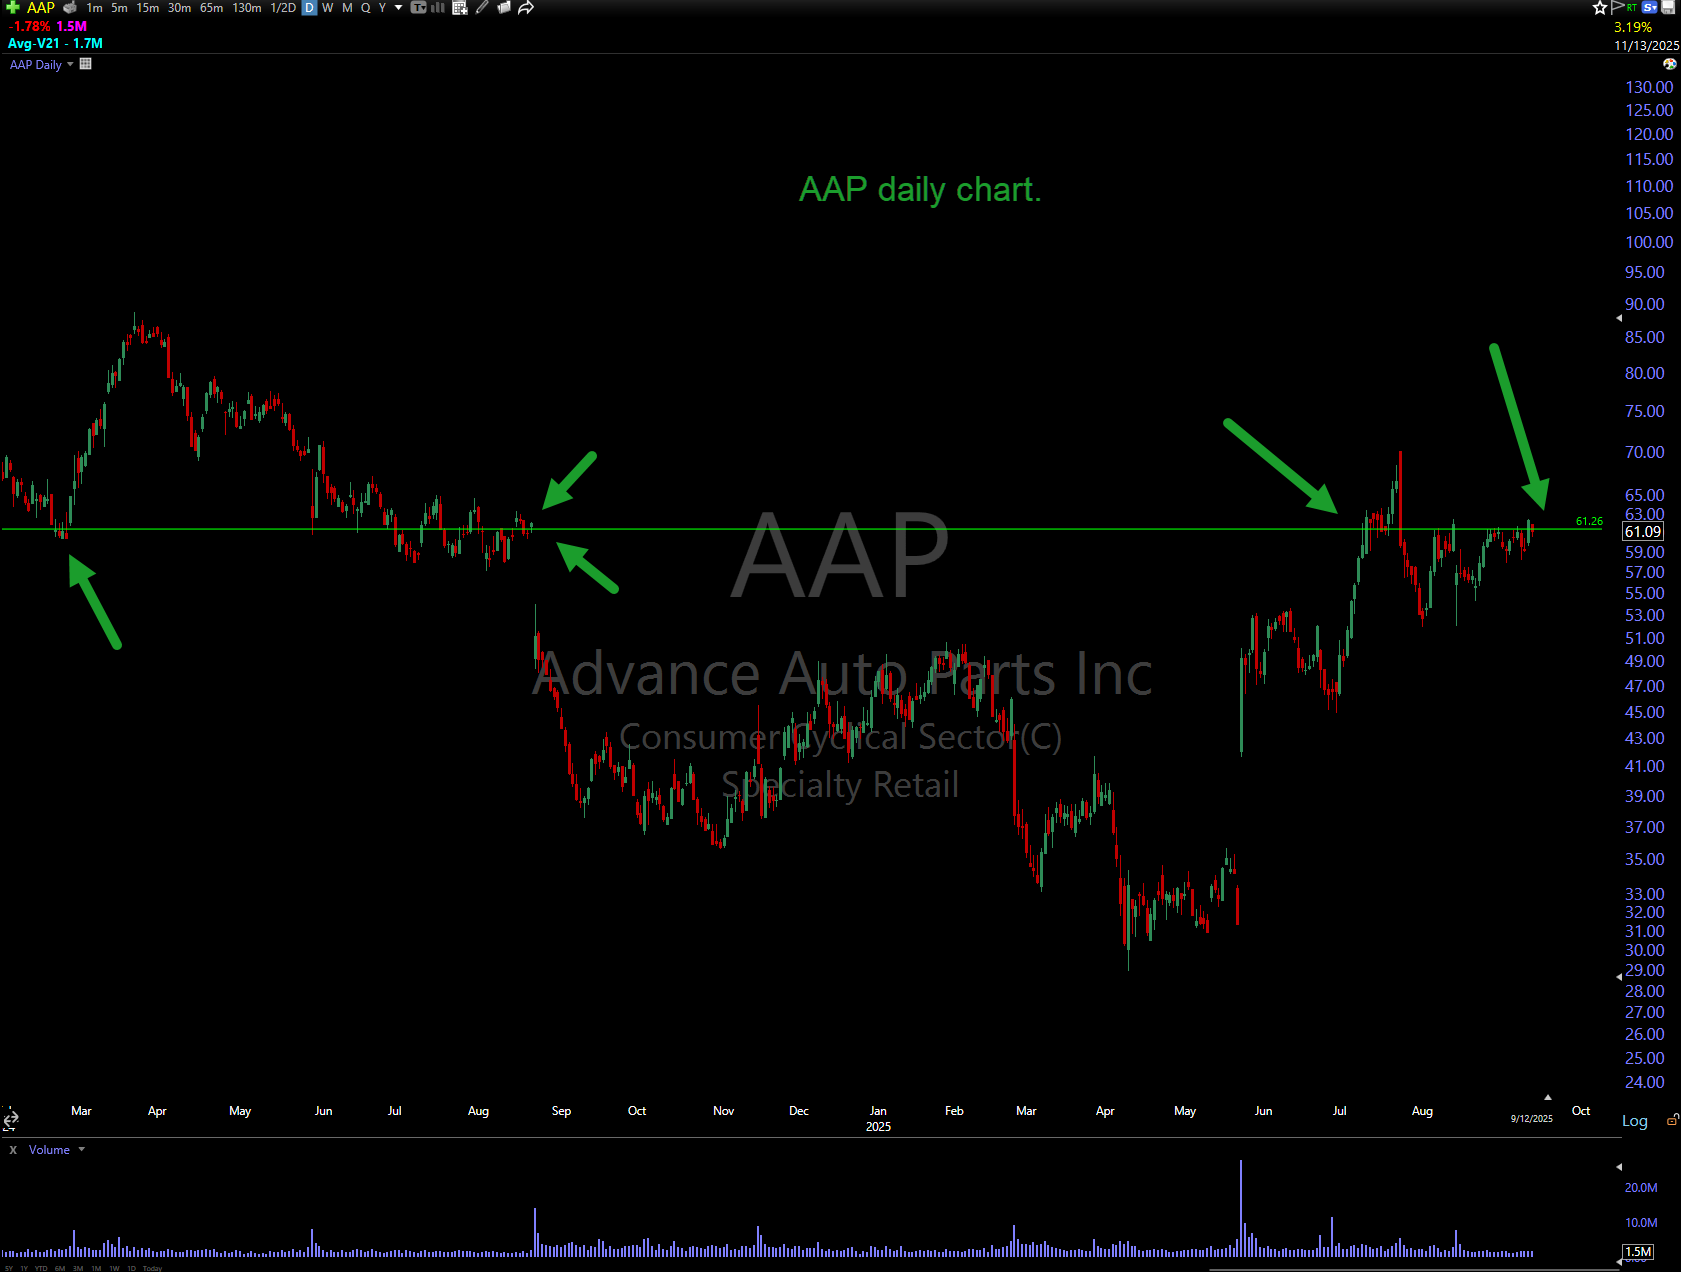
AAP Daily chart above. This one is very interesting. It's been like that wimpy kid trying to hold a beach ball underwater.
This green line, follow it from right to left. Notice how it's been tested over and over and over.
This daily chart is making higher lows and volume is dropping.
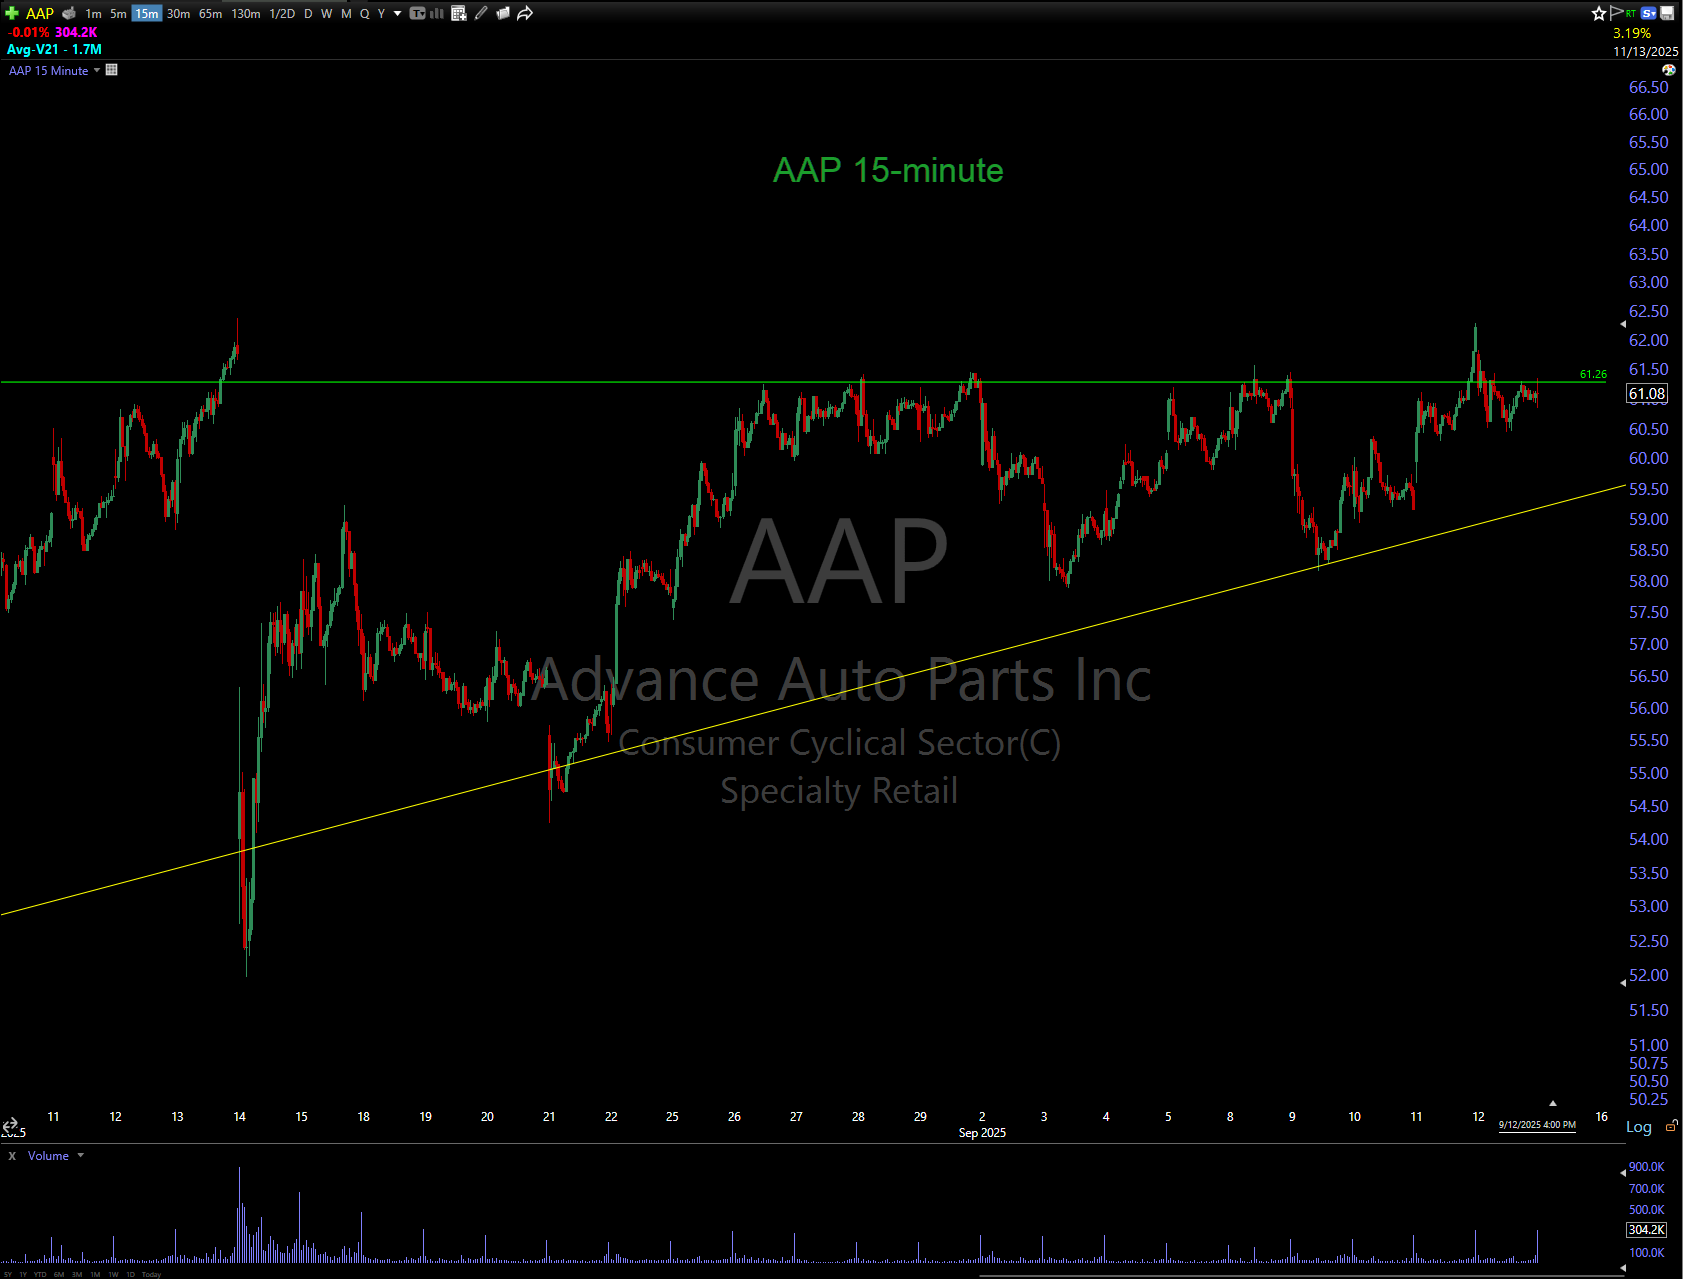
AAP 15-minute. Zoomed in view of the same green line. A high volume break above will get me into this trade.
ABAT
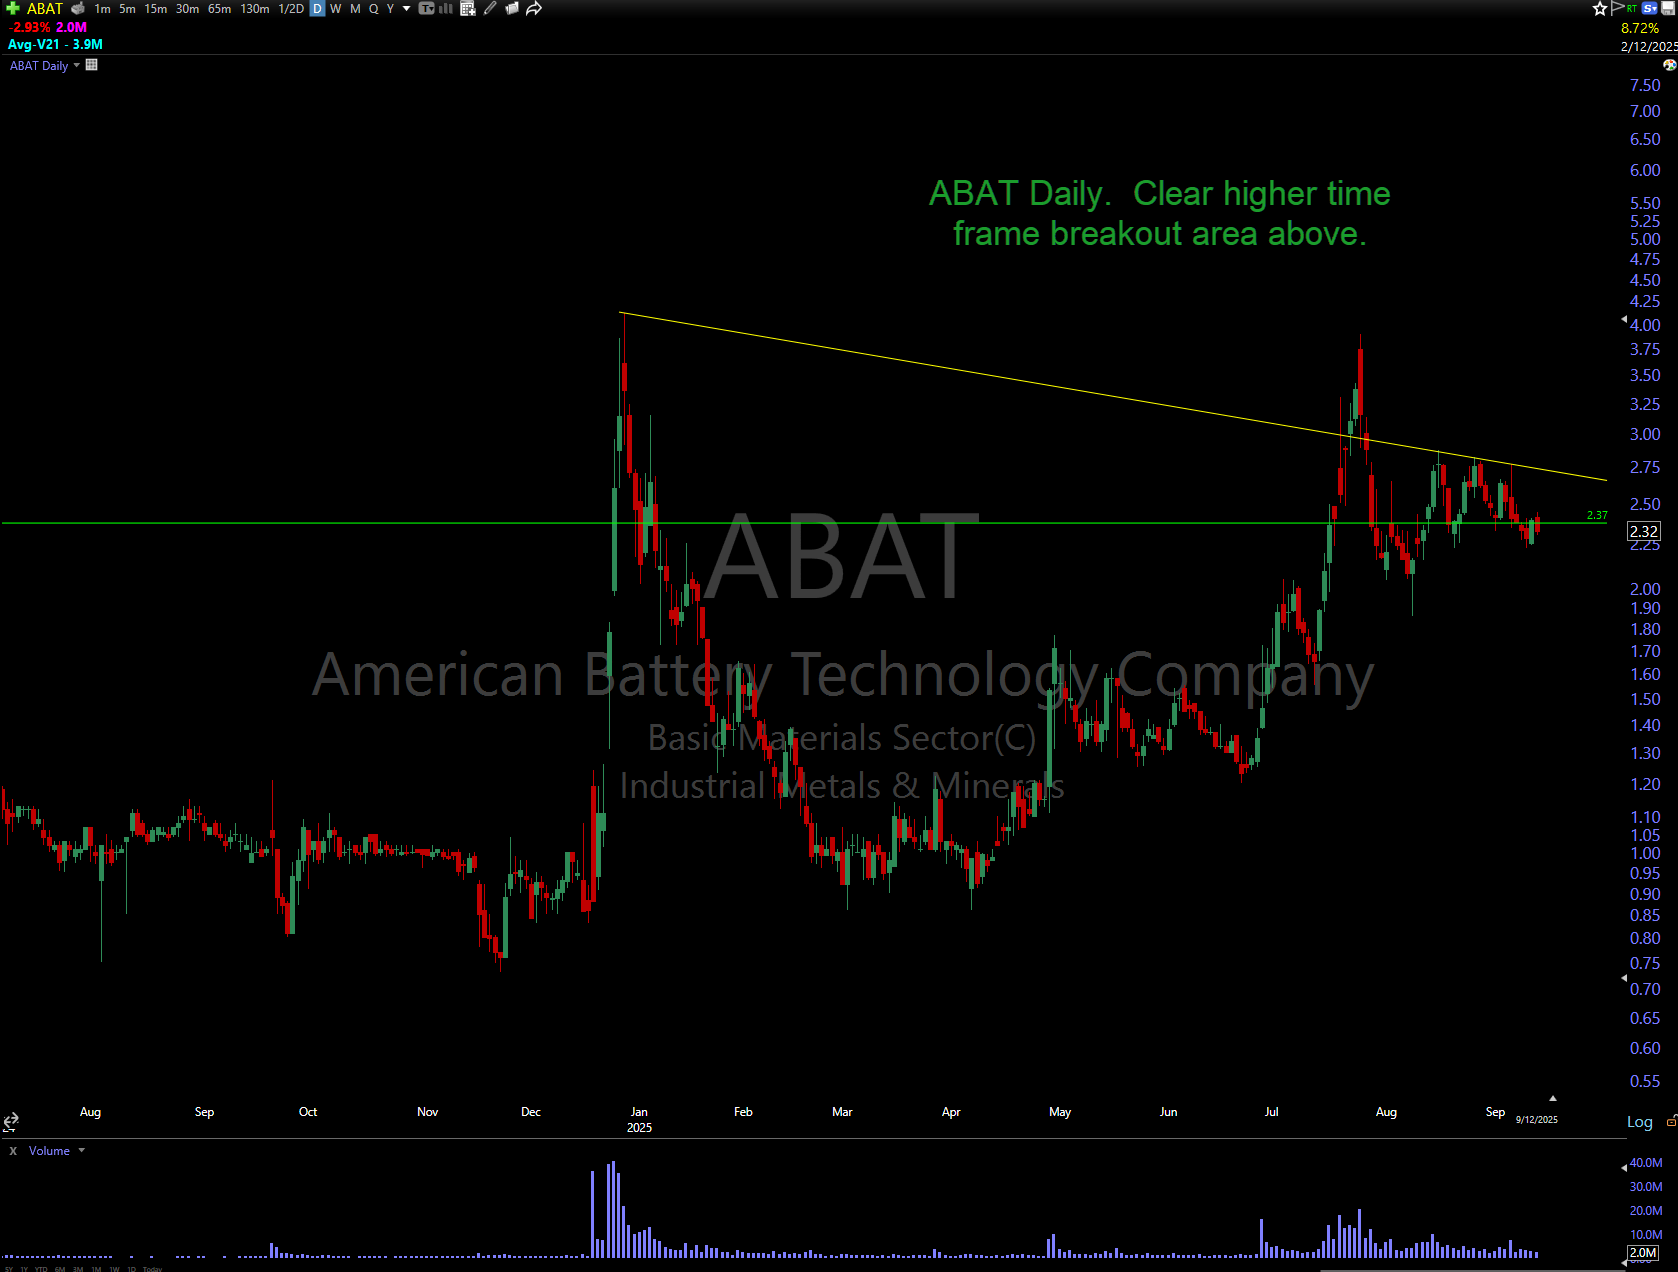
ABAT Daily chart above. Range and volume are decreasing.
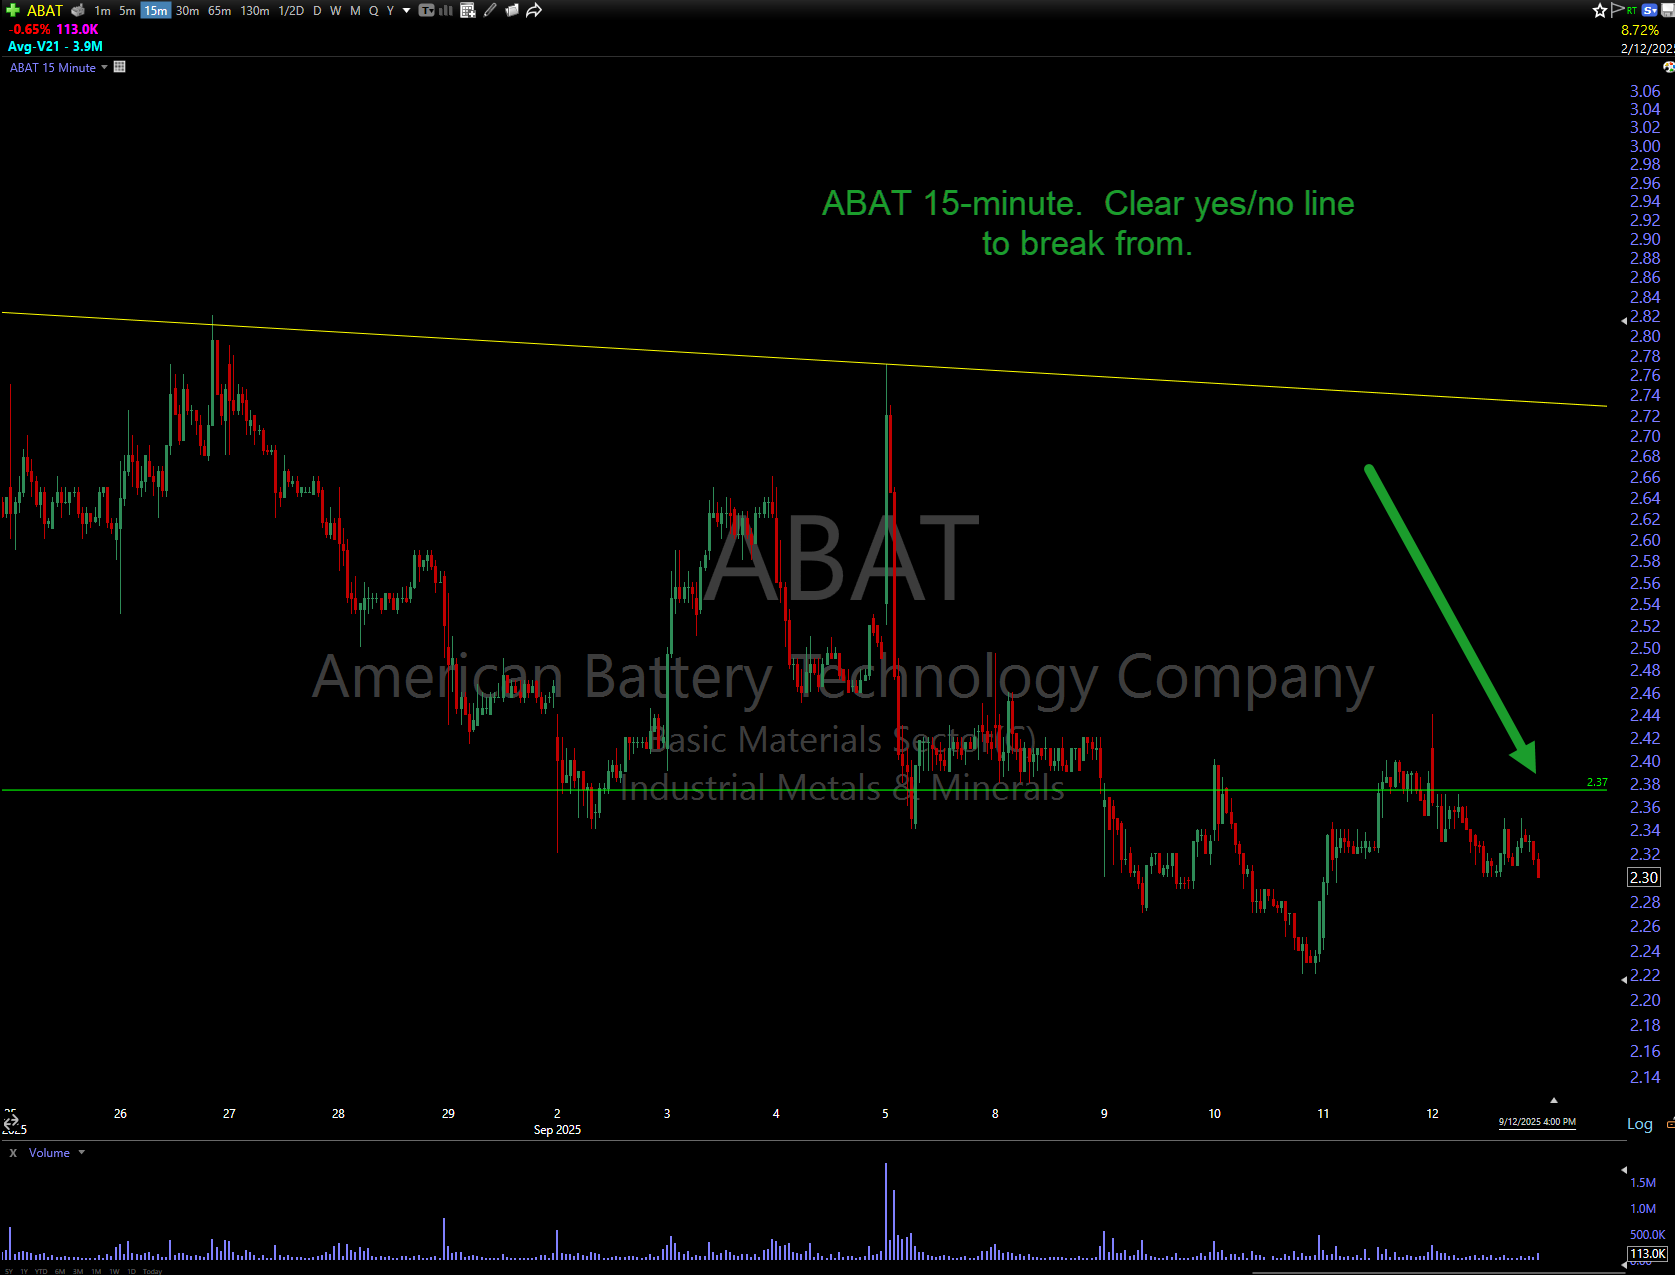
ABAT 15-minute chart above. Clear yes/no line. A high volume 15min break above this line will get me into this trade playing for a break of the higher time frame (yellow) trend line above.
AIIO
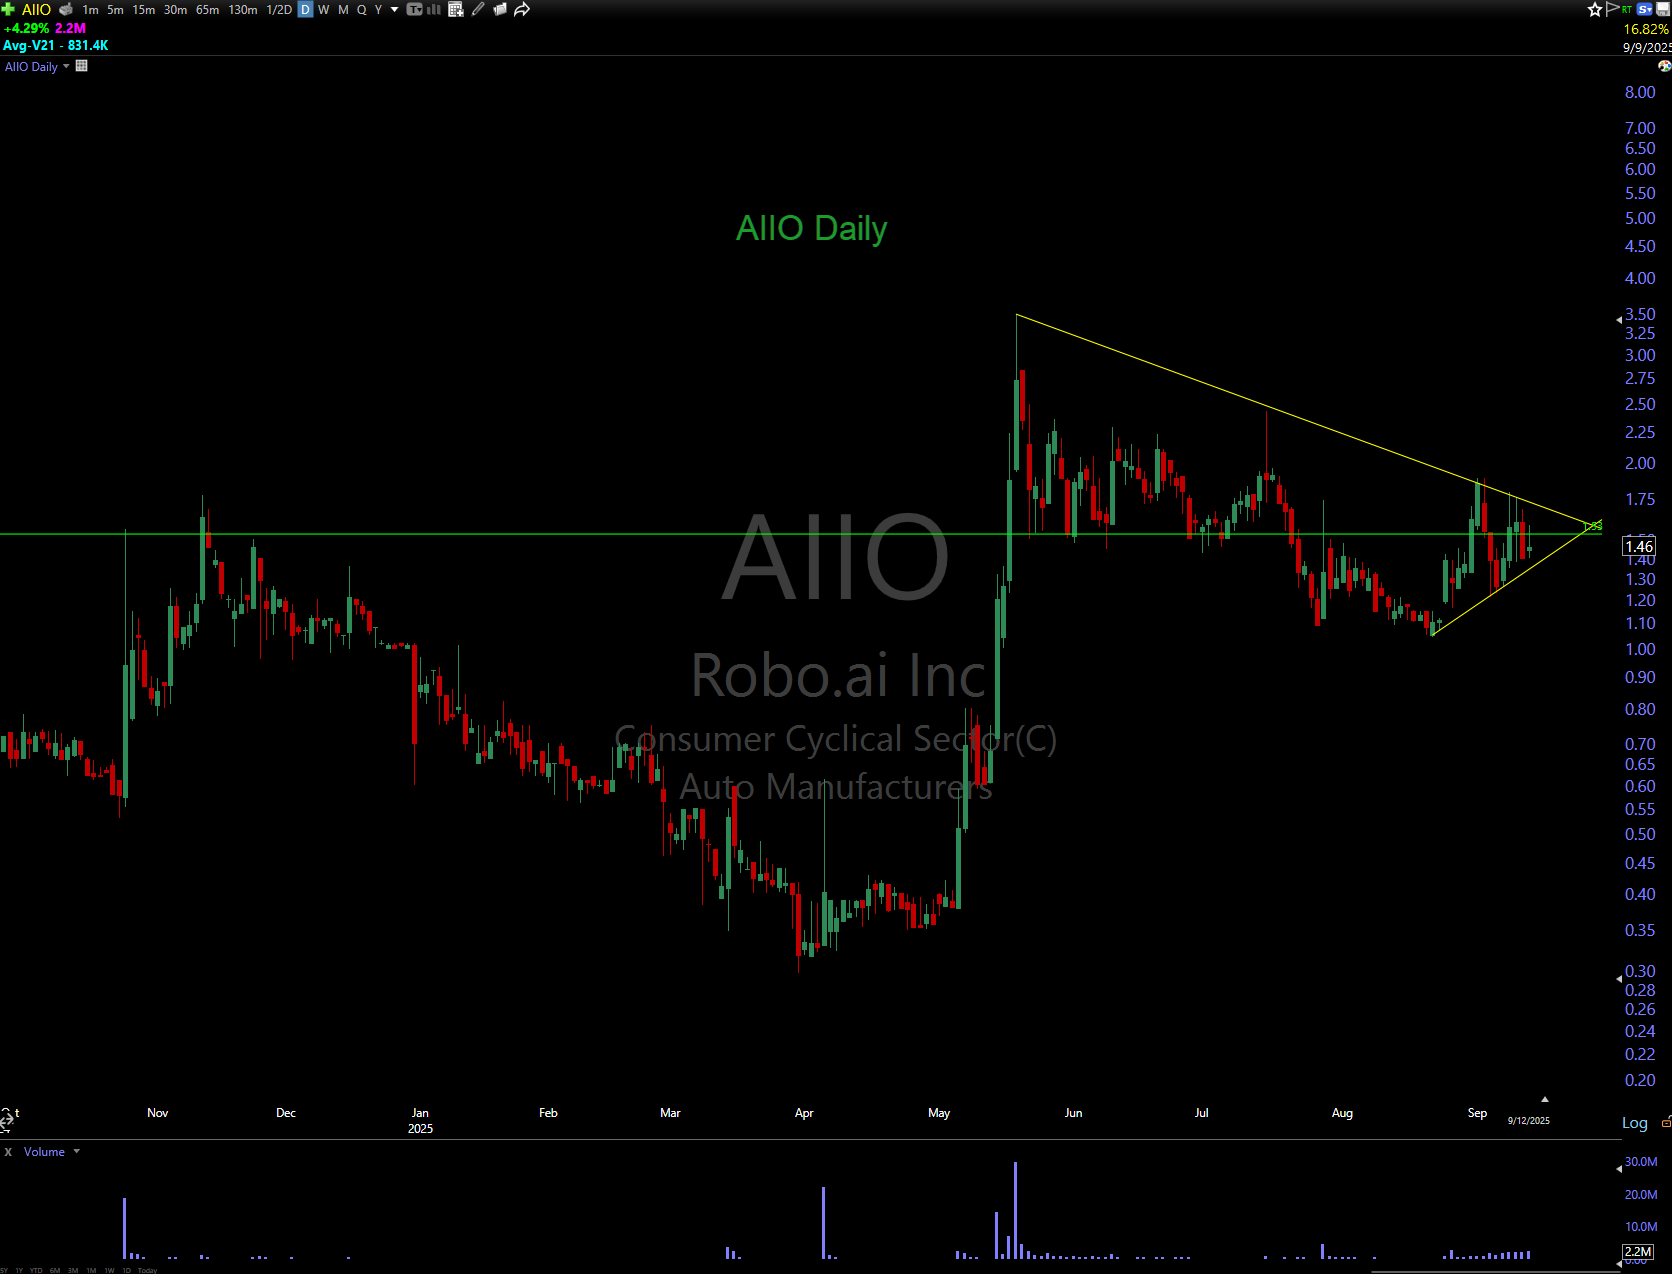
AIIO Daily. This one is not too liquid. And it's choppy intraday. But this daily chart is setting up nicely. Getting tight. Plus, notice the volume is starting to come in very discretely.
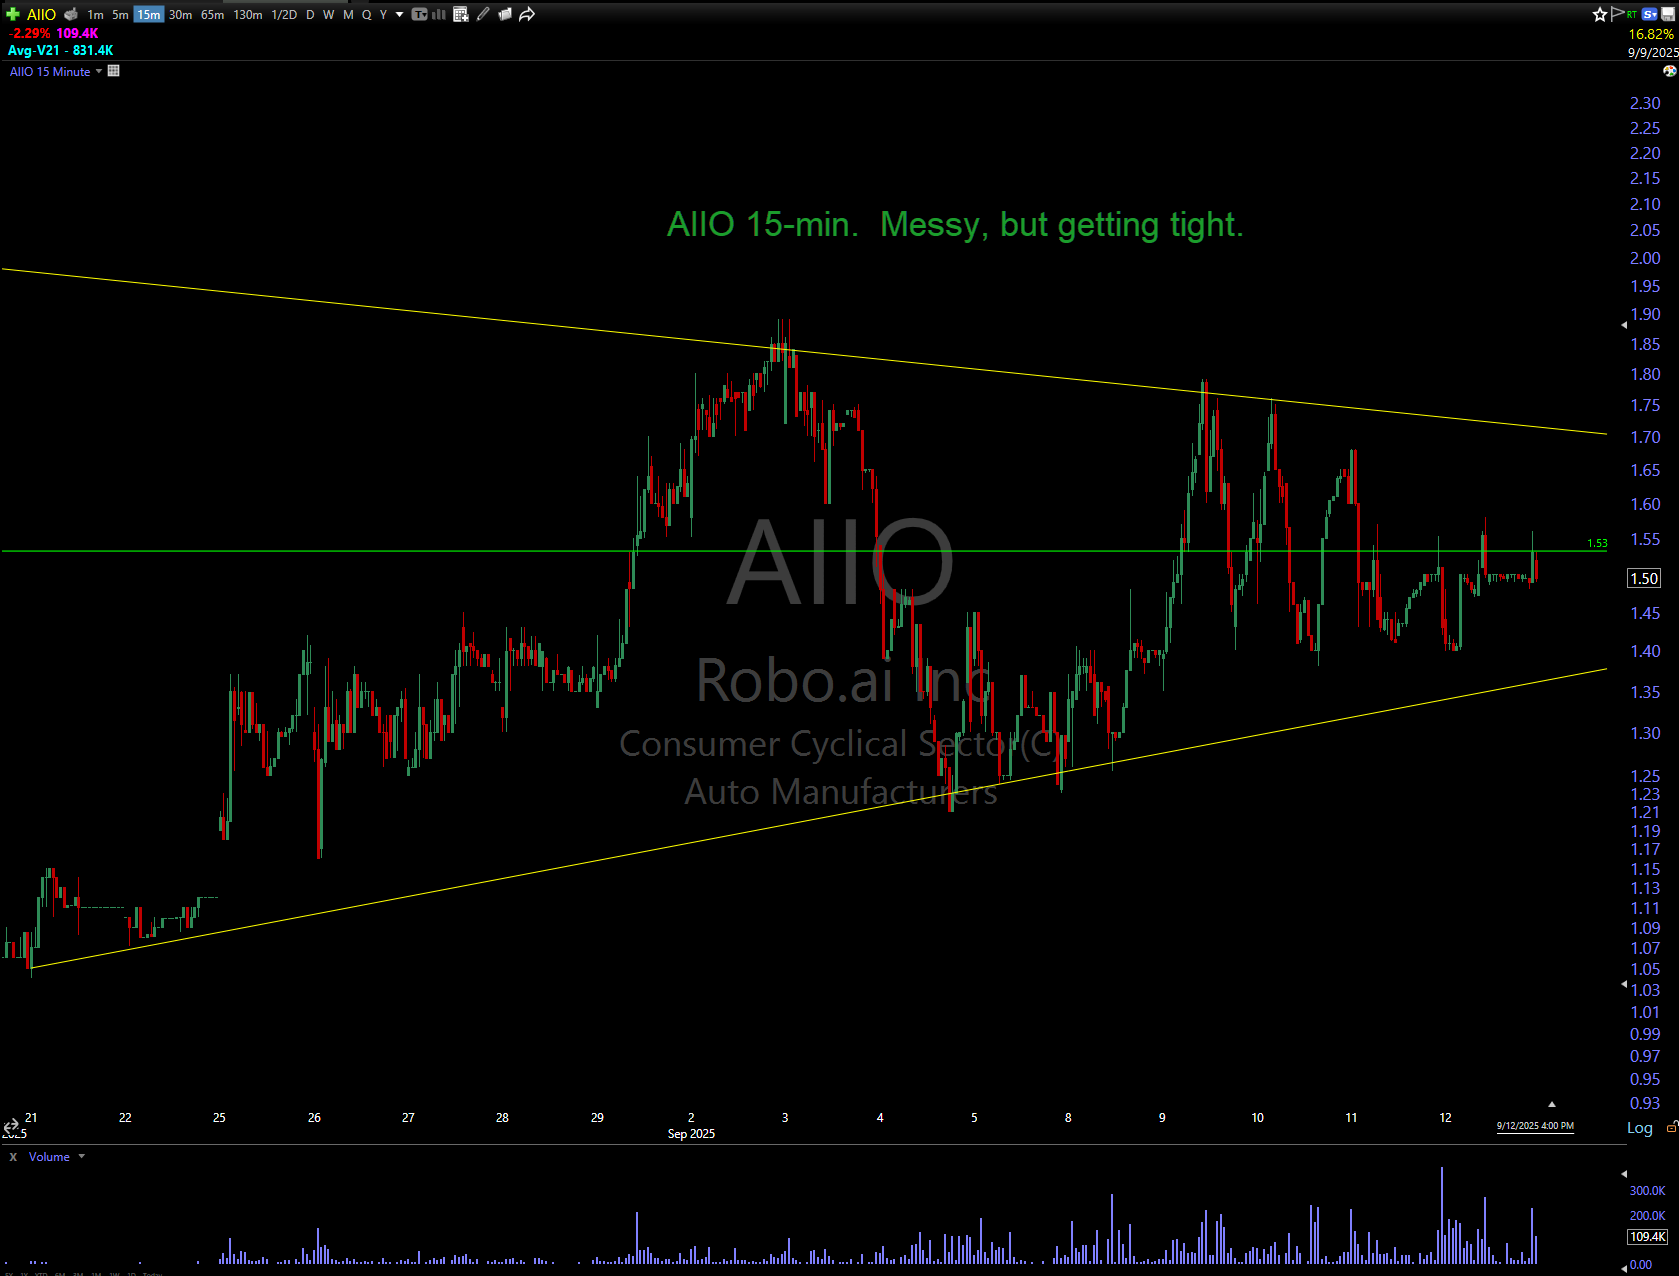
AIIO 15-minute above. Green line is the yes/no line with a yellow breakout trend above. Intraday is choppy and a mess, but on the daily it's getting tight and volume is building. Clear stop out point below the lower trend. Higher risk on this one.
CGC
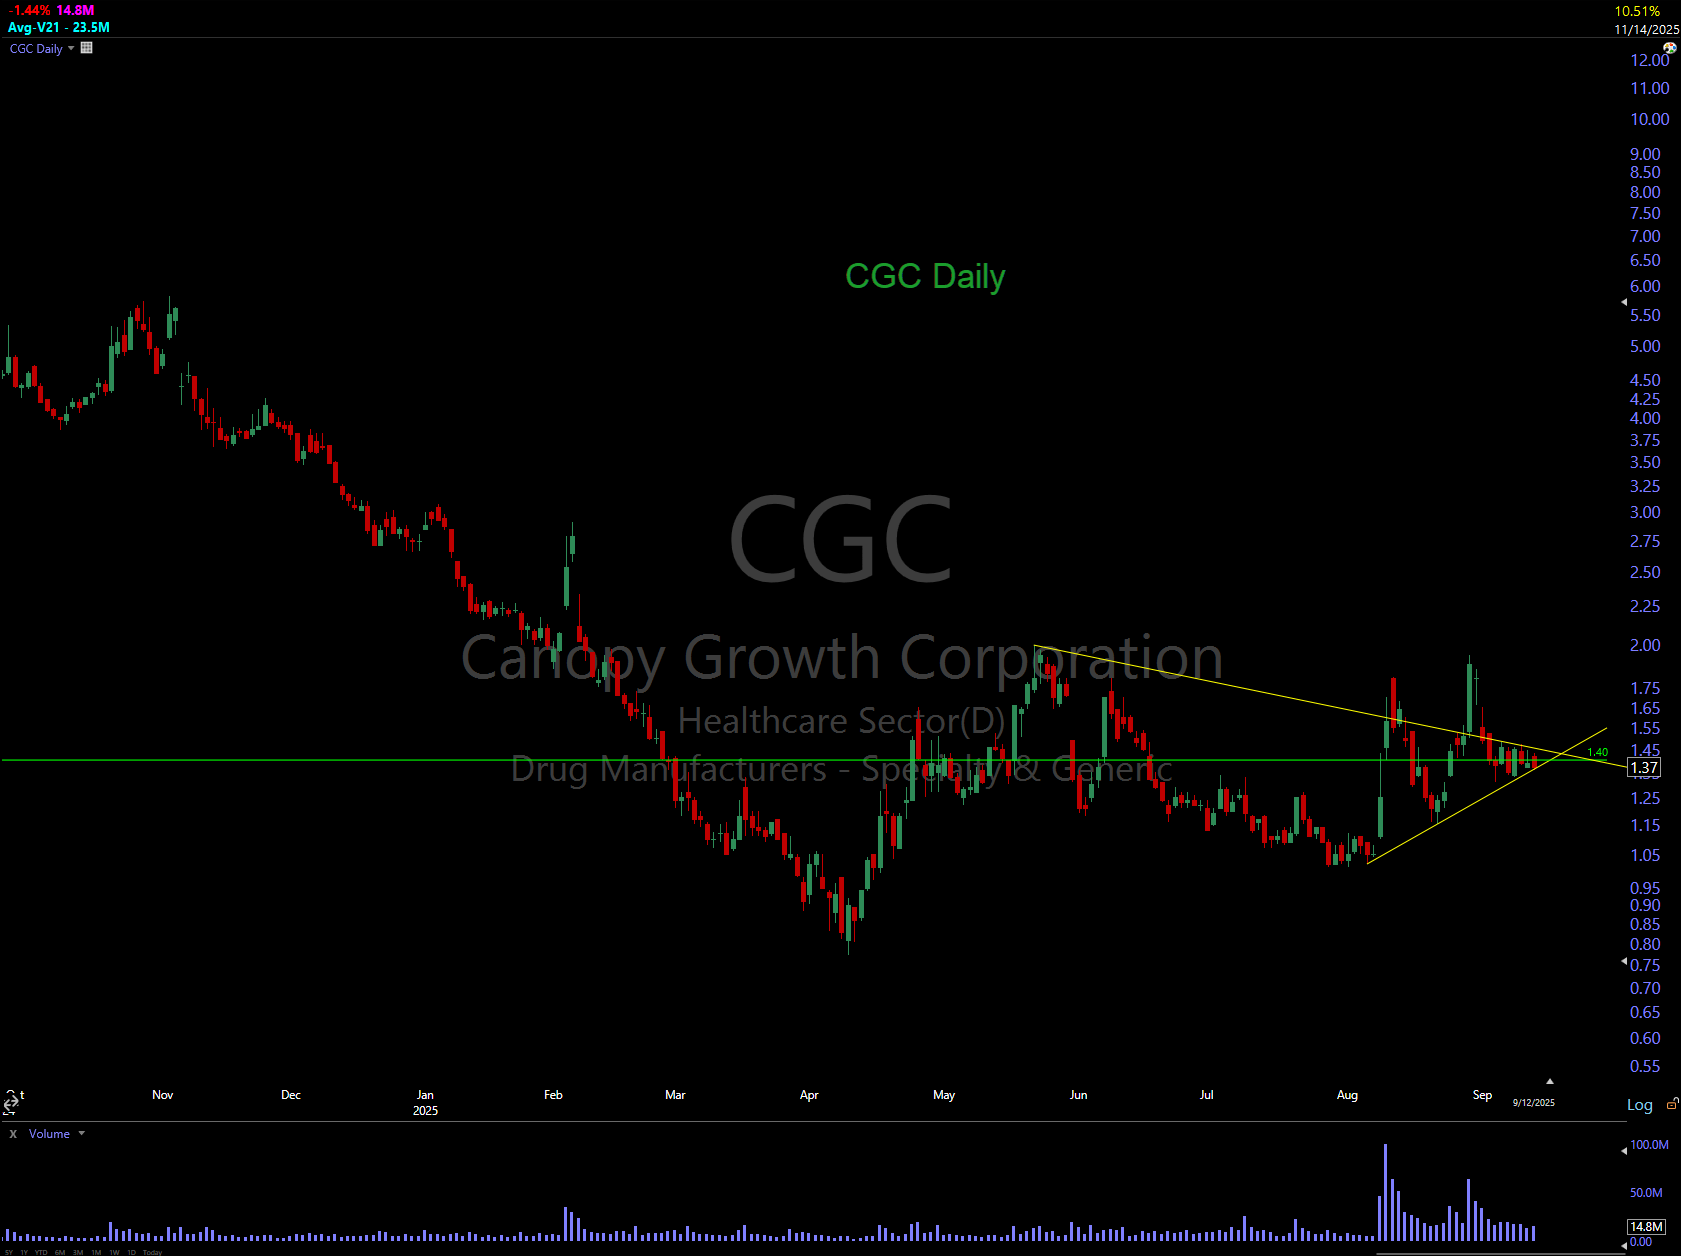
CGC Daily. Getting tight here. Clear yes/no line with a very tight daily range.
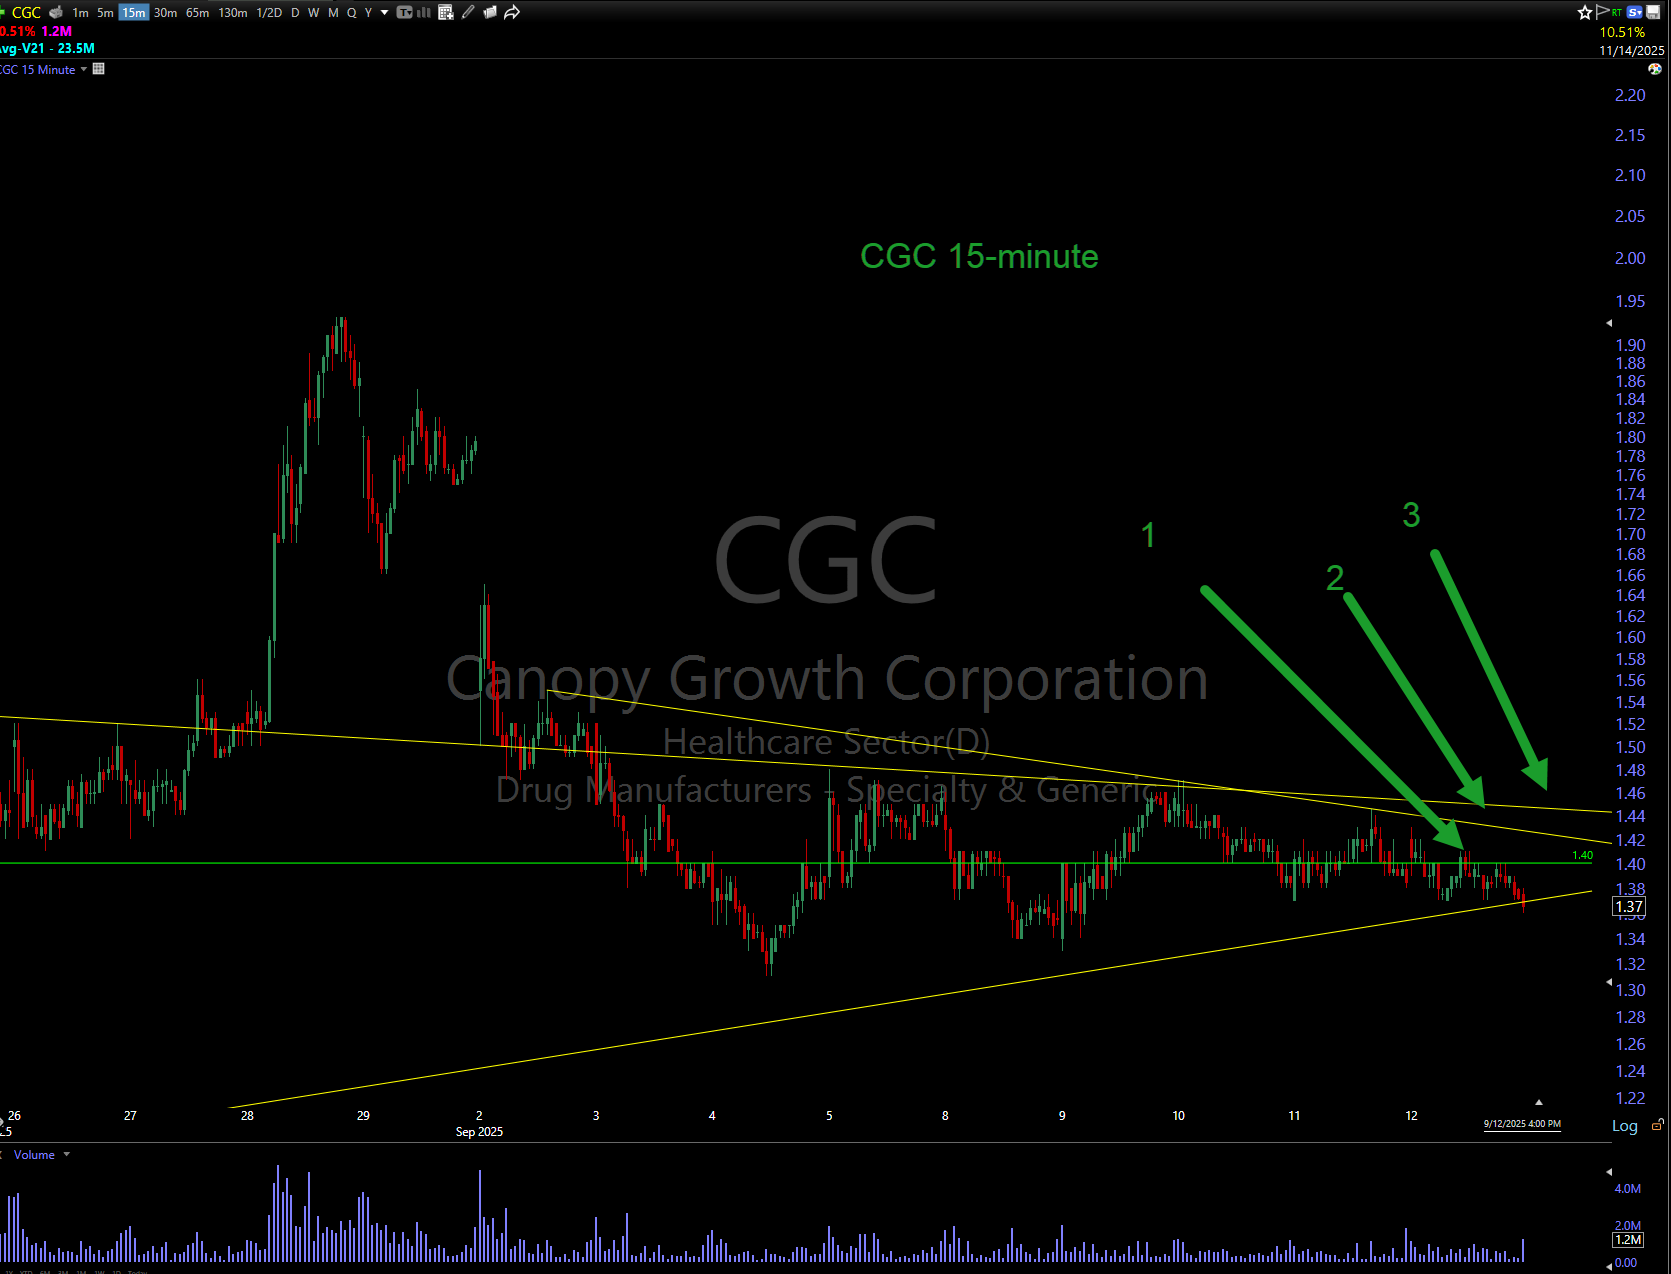
CGC 15-minute. A high volume break above the green line #1 will get me into this trade. Risk is tight with a stop on distribution below the lower yellow line.
DISCLAIMER:
I’m not a financial advisor, nor am I giving you financial advice or advising you to buy or sell anything I post or talk about. I’m posting charts with lines on them with ideas that I like. Please subscribe to this publication only if you’re comfortable making your own financial decisions. Also, please don’t trade with money that you aren’t prepared to lose.